

Question: Using the data in the table a. What was the average dividend yield for the S&P 500 from 2002-2014? c. What was the average annual
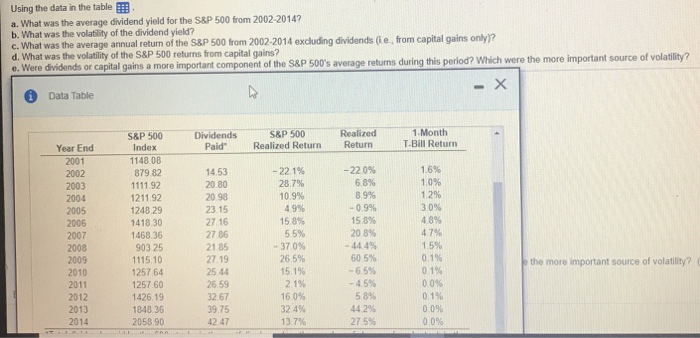
Using the data in the table a. What was the average dividend yield for the S&P 500 from 2002-2014? c. What was the average annual return of the S8P 500 from 2002-2014 excluding dividends (ie, from capital gains only)? volatility of the dividend yield? d. What was the volatility of the S&P 500 returns from capital gains? iod? Which were the more important source of volatility? Data Table S&P 500Dividends S&P 500 Realized1.Month Year End Paid Realized Return ReturnTBill Return Index 20011148 08 2002 2003 2004 2005 2006 2007 2008 2009 2010 2011 2012 2013 2014 879 82 1111.92 1211.92 248 29 1418 30 1468.36 903 25 1115.10 1257 64 125760 1426.19 848.36 2058 90 14.53 20.80 20 98 23.15 27.16 27 86 21.85 27 19 25 44 26.59 32 67 39.75 42 47 -221% 28.7% 10 9% 49% 158% 55% -370% 26 5% 15.1% -22.0% 6.8% 89% -09% 158% 208% -44 4% 60 5% -65% 45% 58% 442% 27 5% 1.6% 1.0% 1 2% 3,0% 4 8% 4 7% 15% 0.1% 0 1% 0 0% 0.1% 0 0% 0.0% the more important source of volatility? 32 4% 137%
Step by Step Solution
There are 3 Steps involved in it

Get step-by-step solutions from verified subject matter experts