

Question: Q1. Using the precedence diagram below and associated data in the attached table, create the following. You must calculate the daily values in the table
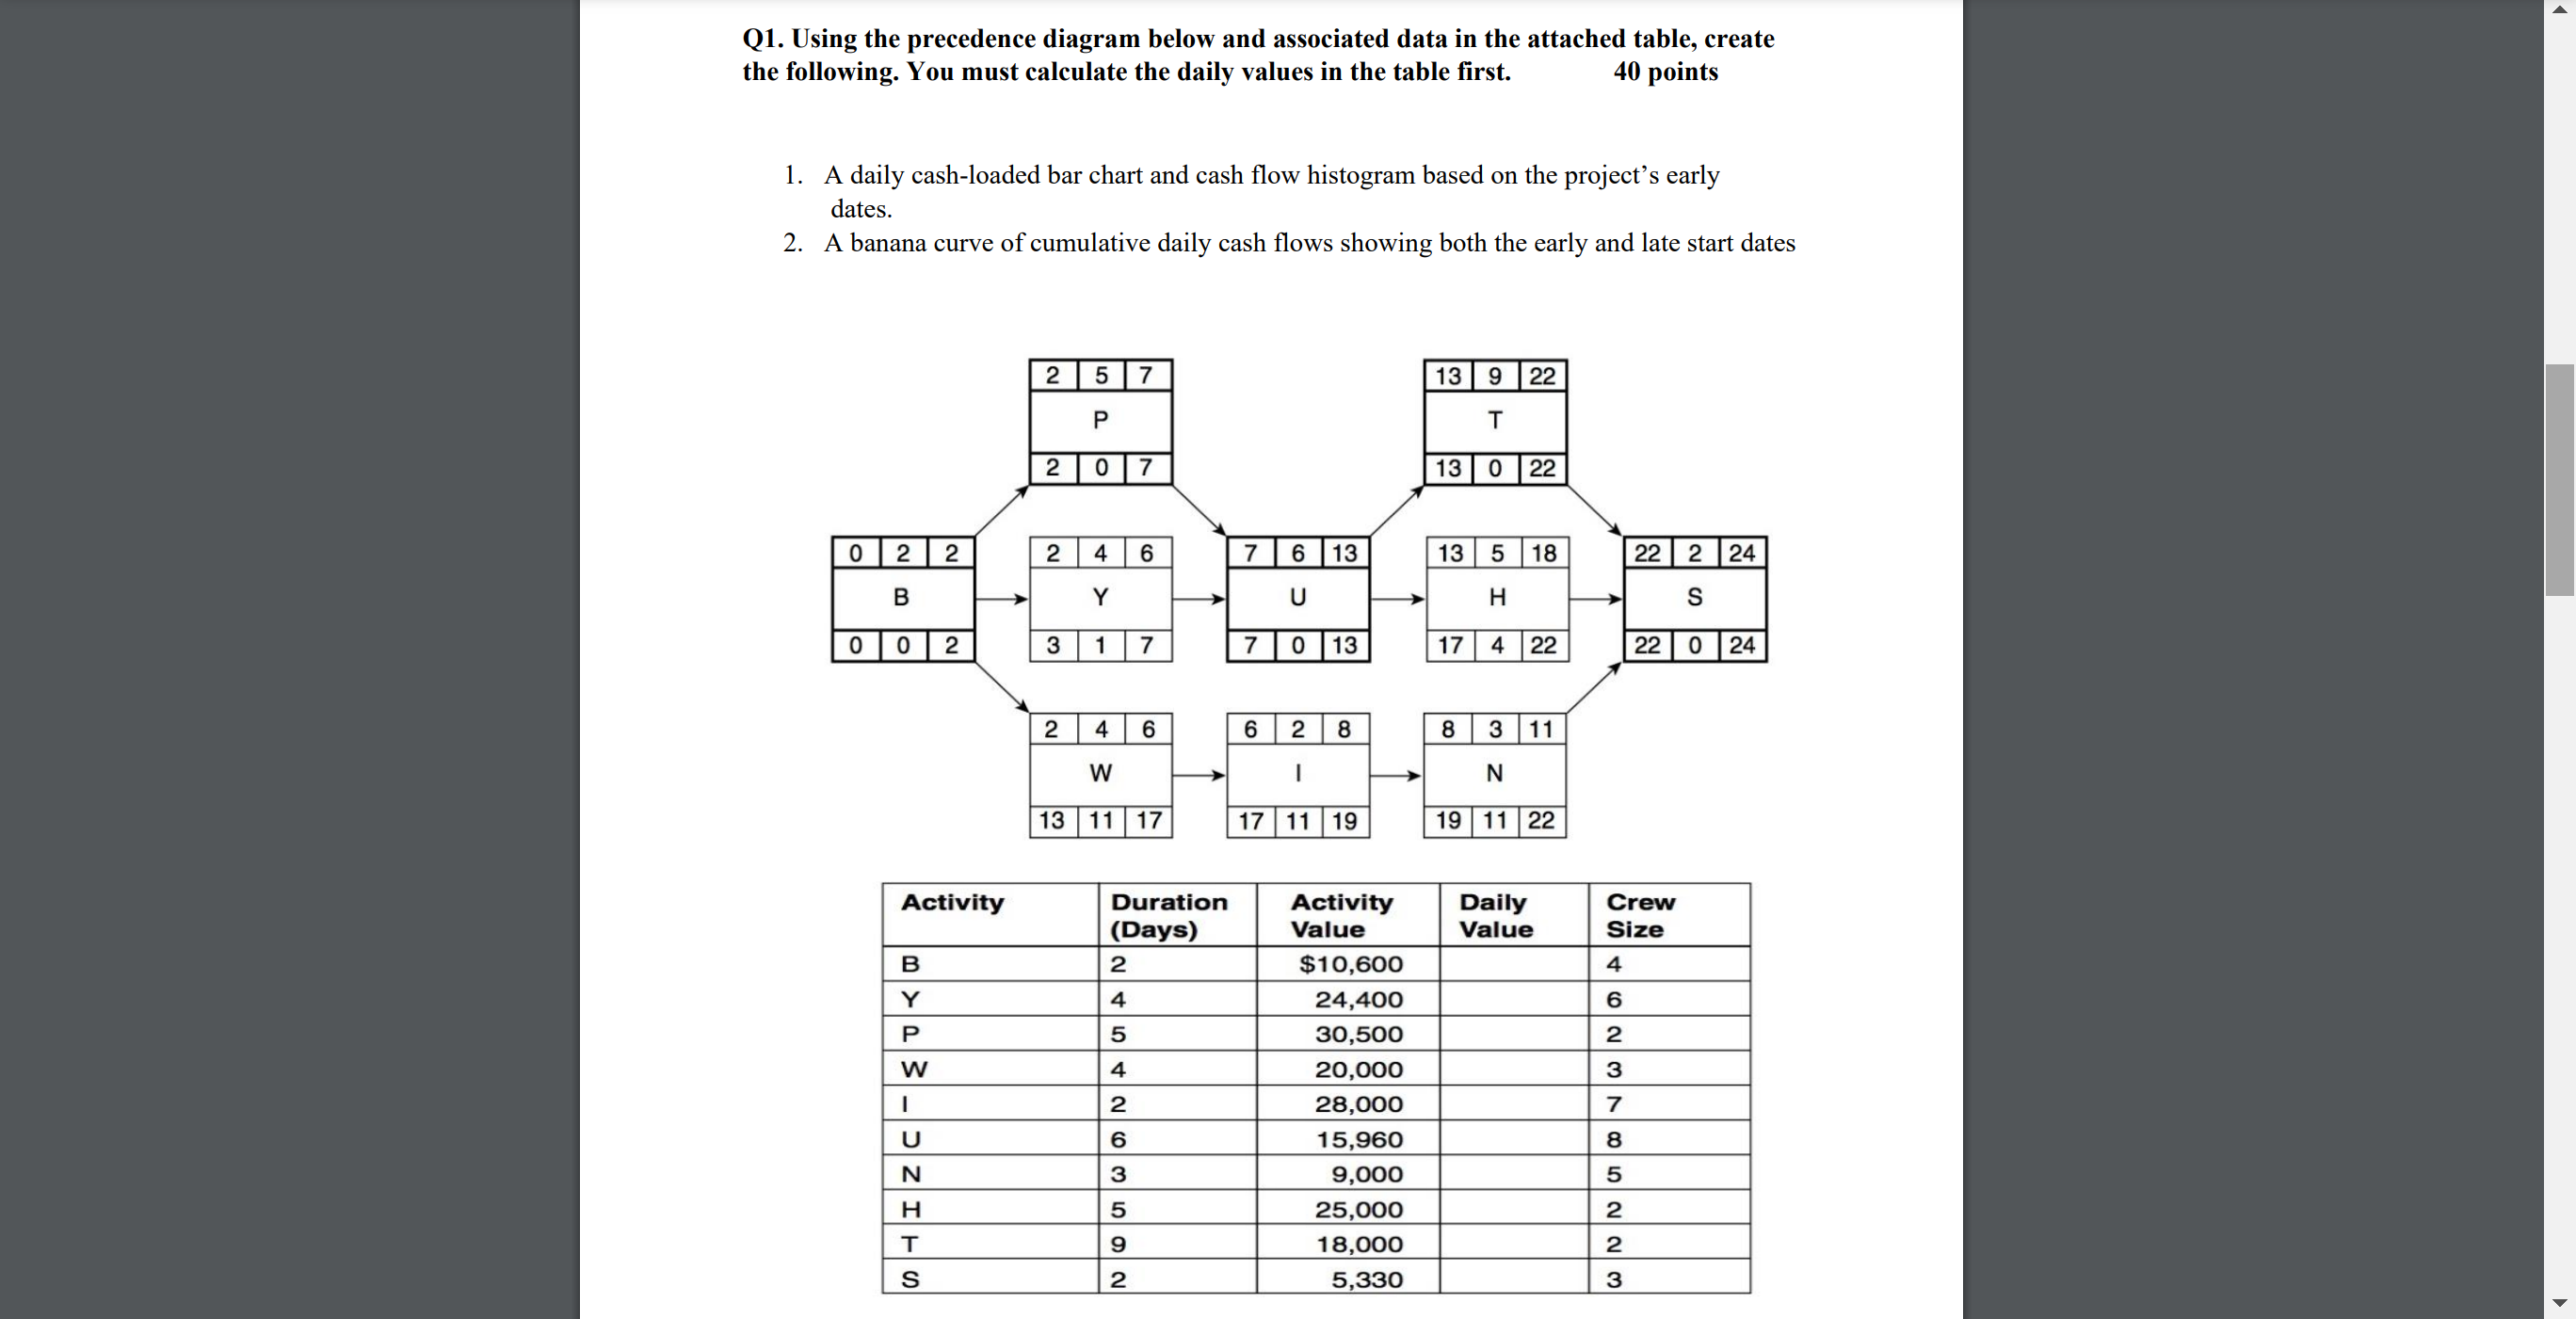
Q1. Using the precedence diagram below and associated data in the attached table, create the following. You must calculate the daily values in the table first. 40 points 1. A daily cash-loaded bar chart and cash flow histogram based on the project's early dates . 2. A banana curve of cumulative daily cash flows showing both the early and late start dates 2 5 7 13 9 22 P T 2 0 7 13 0 22 0 2 2 2 4 6 7 6 13 13 5 18 22 2 24 B Y U H S 0 0 2 3 1 7 7 0 13 17 4 22 22 0 24 2 4 6 6 2 8 3 11 W N 13 11 17 17 11 19 19 11 22 Activity Duration Activity Daily Crew (Days) Value Value Size B 2 $10,600 4 Y 4 24,400 6 P 5 30,500 2 W 4 20,000 3 1 2 28,000 7 U 6 15,960 8 N 3 9,000 5 H 5 25,000 2 T 18,000 2 S IN 5,330 3
Step by Step Solution
There are 3 Steps involved in it

Get step-by-step solutions from verified subject matter experts