Question: this cousre production and inventory systems Question 1 (30 points): The following table shows the actual and forecast demand of the textbook production planning and

this cousre production and inventory systems this cousre production and inventory systems
Question 1 (30 points): The following table shows the actual and forecast demand of the textbook "production planning and operations analysis, by Nahmias" at University of Sharjah bookstore. Date Actual demand Forecast value (textbooks/day) (textbooks/day) 7-september 2014 0 8-Sept. 2 9-Sept. 7 10-Sept. 15 11-Sept. 8 10 12-Sept. 7 13-Sept. 14-Sept. 6 12 8 Calculate the different forecast assessment measures, namely: MAD, MSE, MAPE. Question 2 (30 points): For the same actual demand data above, perform a forecast using: . Moving average of 3 periods. Exponential smoothing of (a=0.2). Make the first forecast value equal to the actual demand. Sketch your results on an excel sheet (period vs. Demand and vs. forecast values) Question 3 (40 points): The demand on Samsung TVs at Xcite stores for the past 3 years is given in this table in units/season: Year 1 Year 2 Year 3 Spring 1500 1650 1550 Summer 1000 900 850 500 600 550 Winter 200 150 220 Fall Use seasonality indexing to forecast the values of the 4 year. Sketch both actual and forecast values using Excel

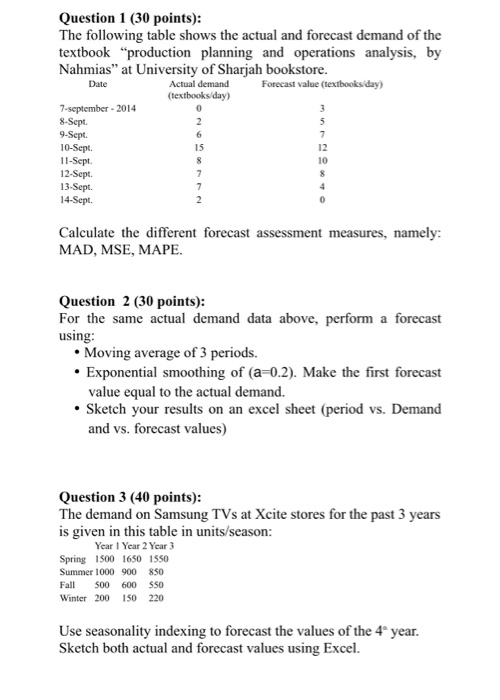
Step by Step Solution

There are 3 Steps involved in it

1 Expert Approved Answer
Step: 1 Unlock blur-text-image
Question Has Been Solved by an Expert!

Get step-by-step solutions from verified subject matter experts

Step: 2 Unlock
Step: 3 Unlock

Students Have Also Explored These Related General Management Questions!