

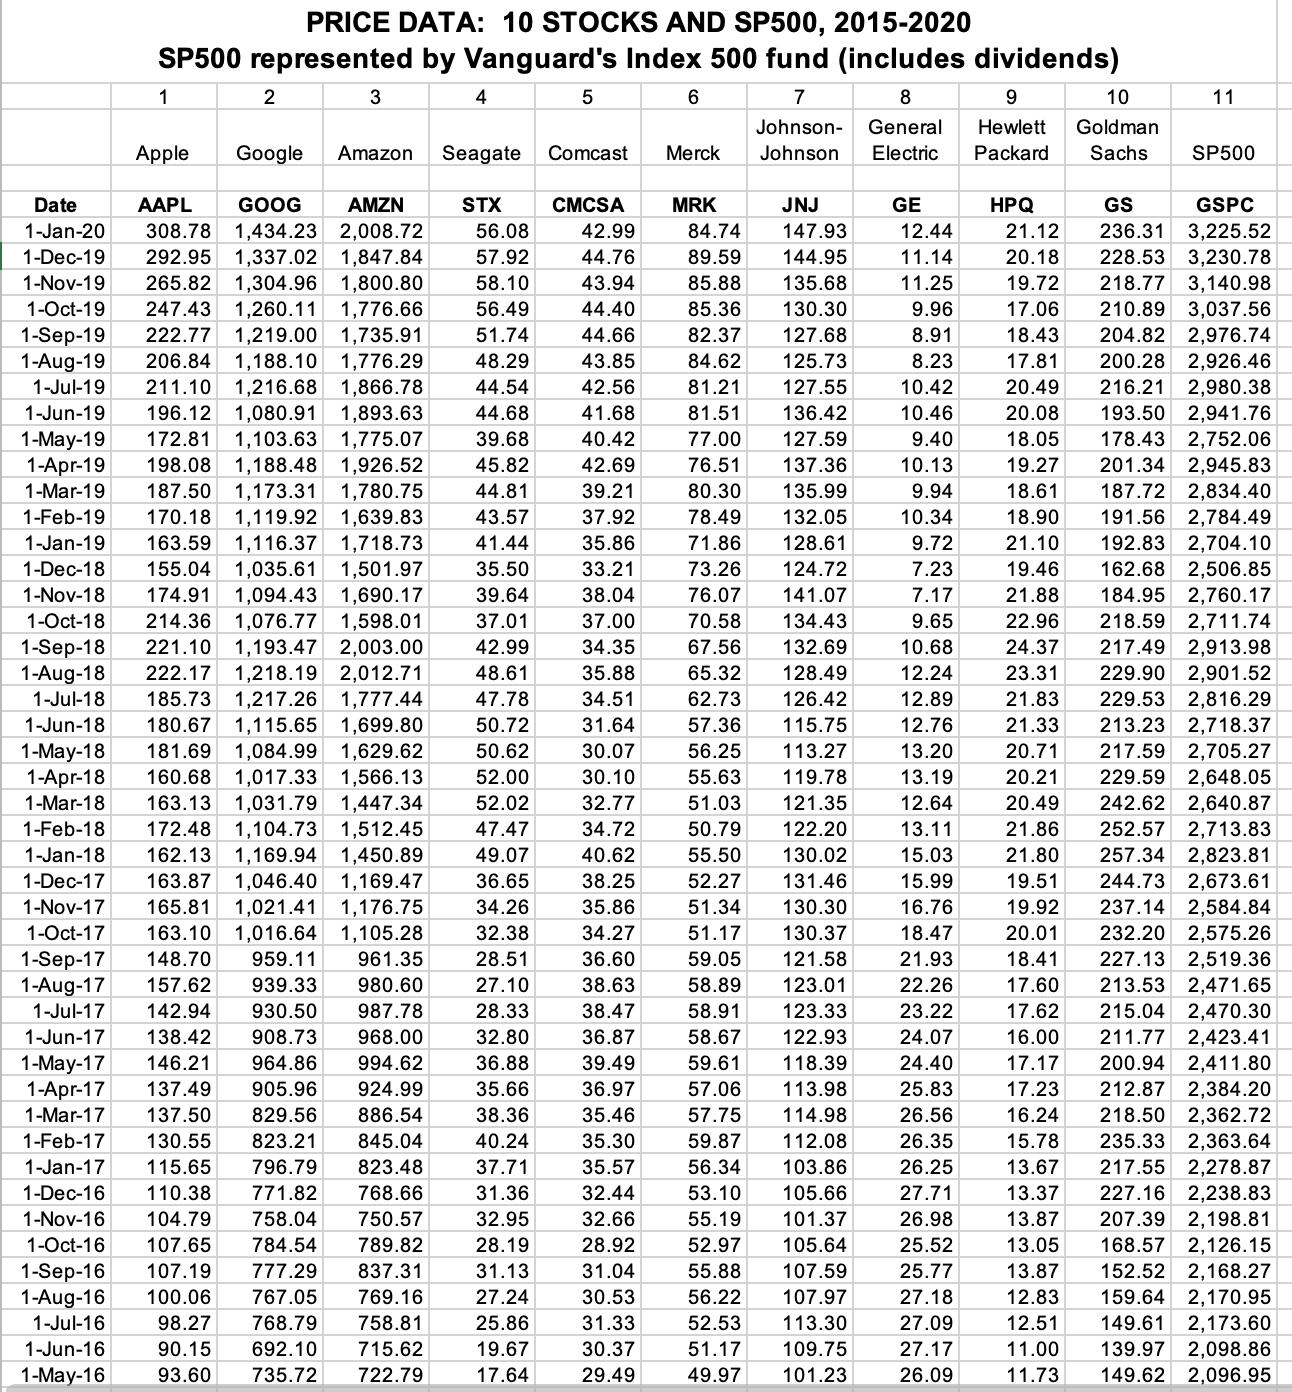
Question: Q1: You are also given an Excel template in the attachment, please fill in the template file (in the second spreadsheet - calculating mean, variance,
Q1: You are also given an Excel template in the attachment, please fill in the template file (in the second spreadsheet - calculating mean, variance, and sigma of each stock).
Q2: Perform the second-pass regression: Regress the monthly average returns on the betas of the assets. Does this confirm that the S&P 500 is efficient?
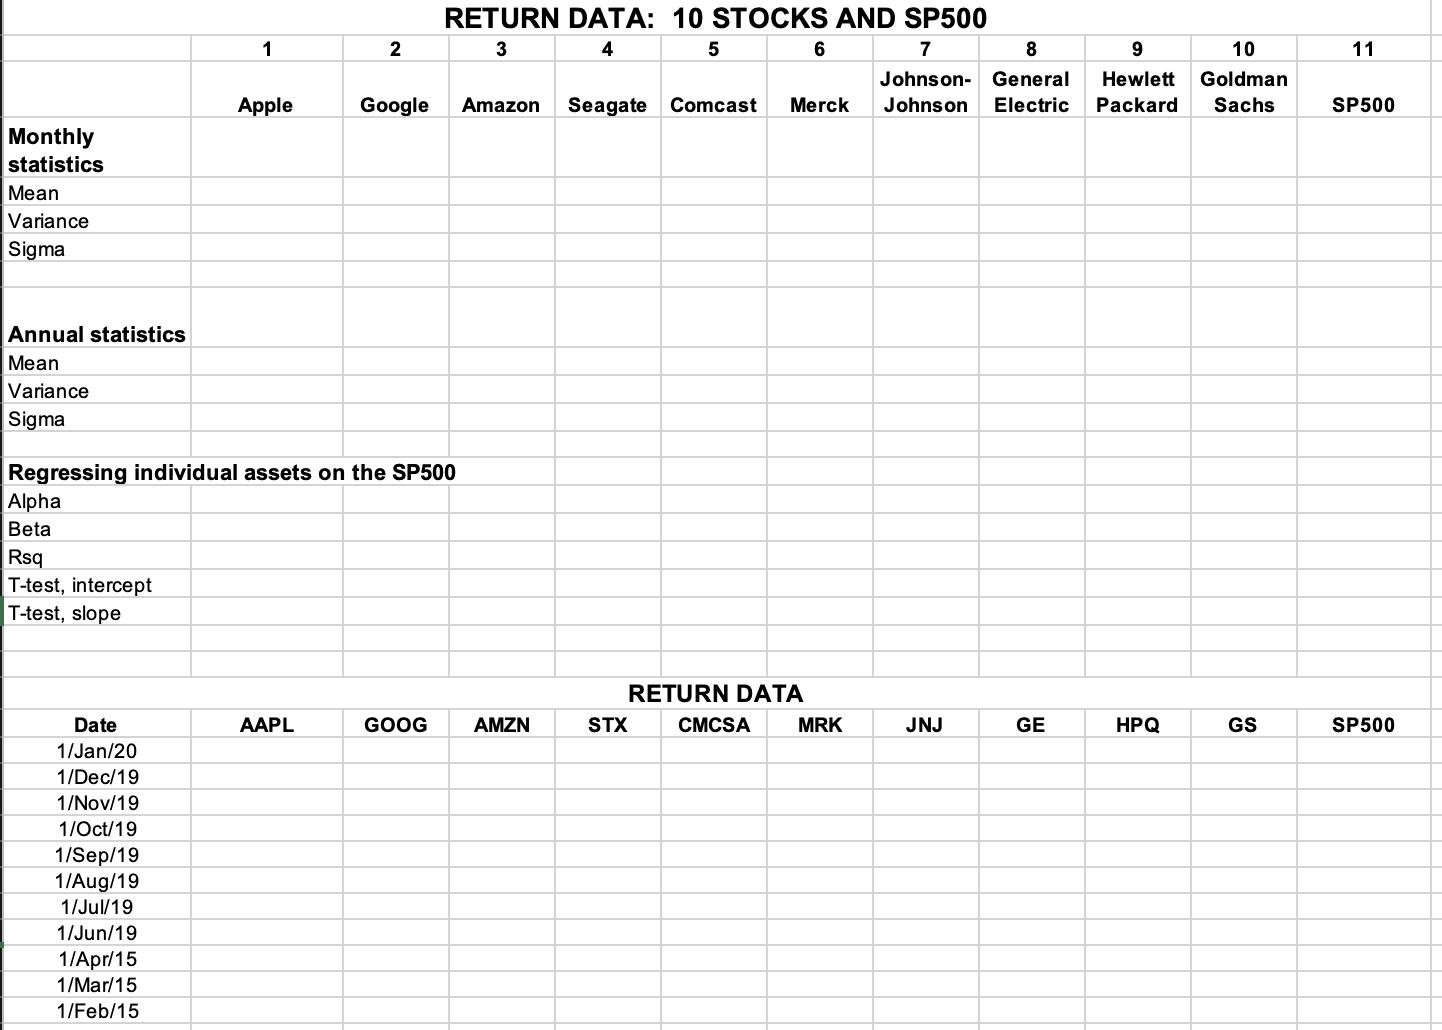
\f\fRETURN DATA: 10 STOCKS AND SP500 2 3 5 8 9 10 11 Johnson- General Hewlett Goldman Apple Google Amazon Seagate Comcast Merck Johnson Electric Packard Sachs SP500 Monthly statistics Mean Variance Sigma Annual statistics Mean Variance Sigma Regressing individual assets on the SP500 Alpha Beta Rsq T-test, intercept T-test, slope RETURN DATA Date AAPL GOOG AMZN STX CMCSA MRK JNJ GE HPQ GS SP500 1/Jan/20 1/Dec/19 1/Nov/19 1/Oct/19 1/Sep/19 1/Aug/19 1/Jul/19 1/Jun/19 1/Apr/15 1/Mar/15 1/Feb/15
Step by Step Solution
There are 3 Steps involved in it

Get step-by-step solutions from verified subject matter experts