

Question: Q1)-(10 marks) Control Chart for X and R- chart are maintained fo Quality Characteristics. The sample size is n=6, and x and R are computed
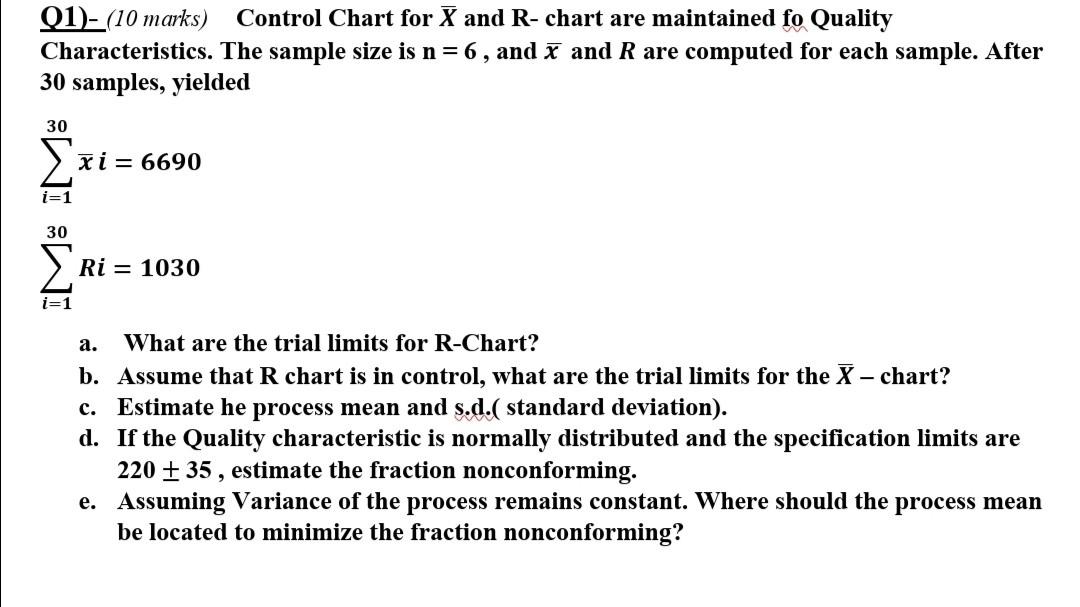
Q1)-(10 marks) Control Chart for X and R- chart are maintained fo Quality Characteristics. The sample size is n=6, and x and R are computed for each sample. After 30 samples, yielded 30 i= 6690 i=1 30 Ri = 1030 i=1 a. What are the trial limits for R-Chart? b. Assume that R chart is in control, what are the trial limits for the X - chart? c. Estimate he process mean and s.d.( standard deviation). d. If the Quality characteristic is normally distributed and the specification limits are 220 + 35, estimate the fraction nonconforming. e. Assuming Variance of the process remains constant. Where should the process mean be located to minimize the fraction nonconforming
Step by Step Solution
There are 3 Steps involved in it
1 Expert Approved Answer
Step: 1 Unlock

Question Has Been Solved by an Expert!
Get step-by-step solutions from verified subject matter experts
Step: 2 Unlock
Step: 3 Unlock