

Question: Q12) kindly read the table below and answer it's questions. (2 attache) Explain and use graph to illustrate the following: . Increase in supply and
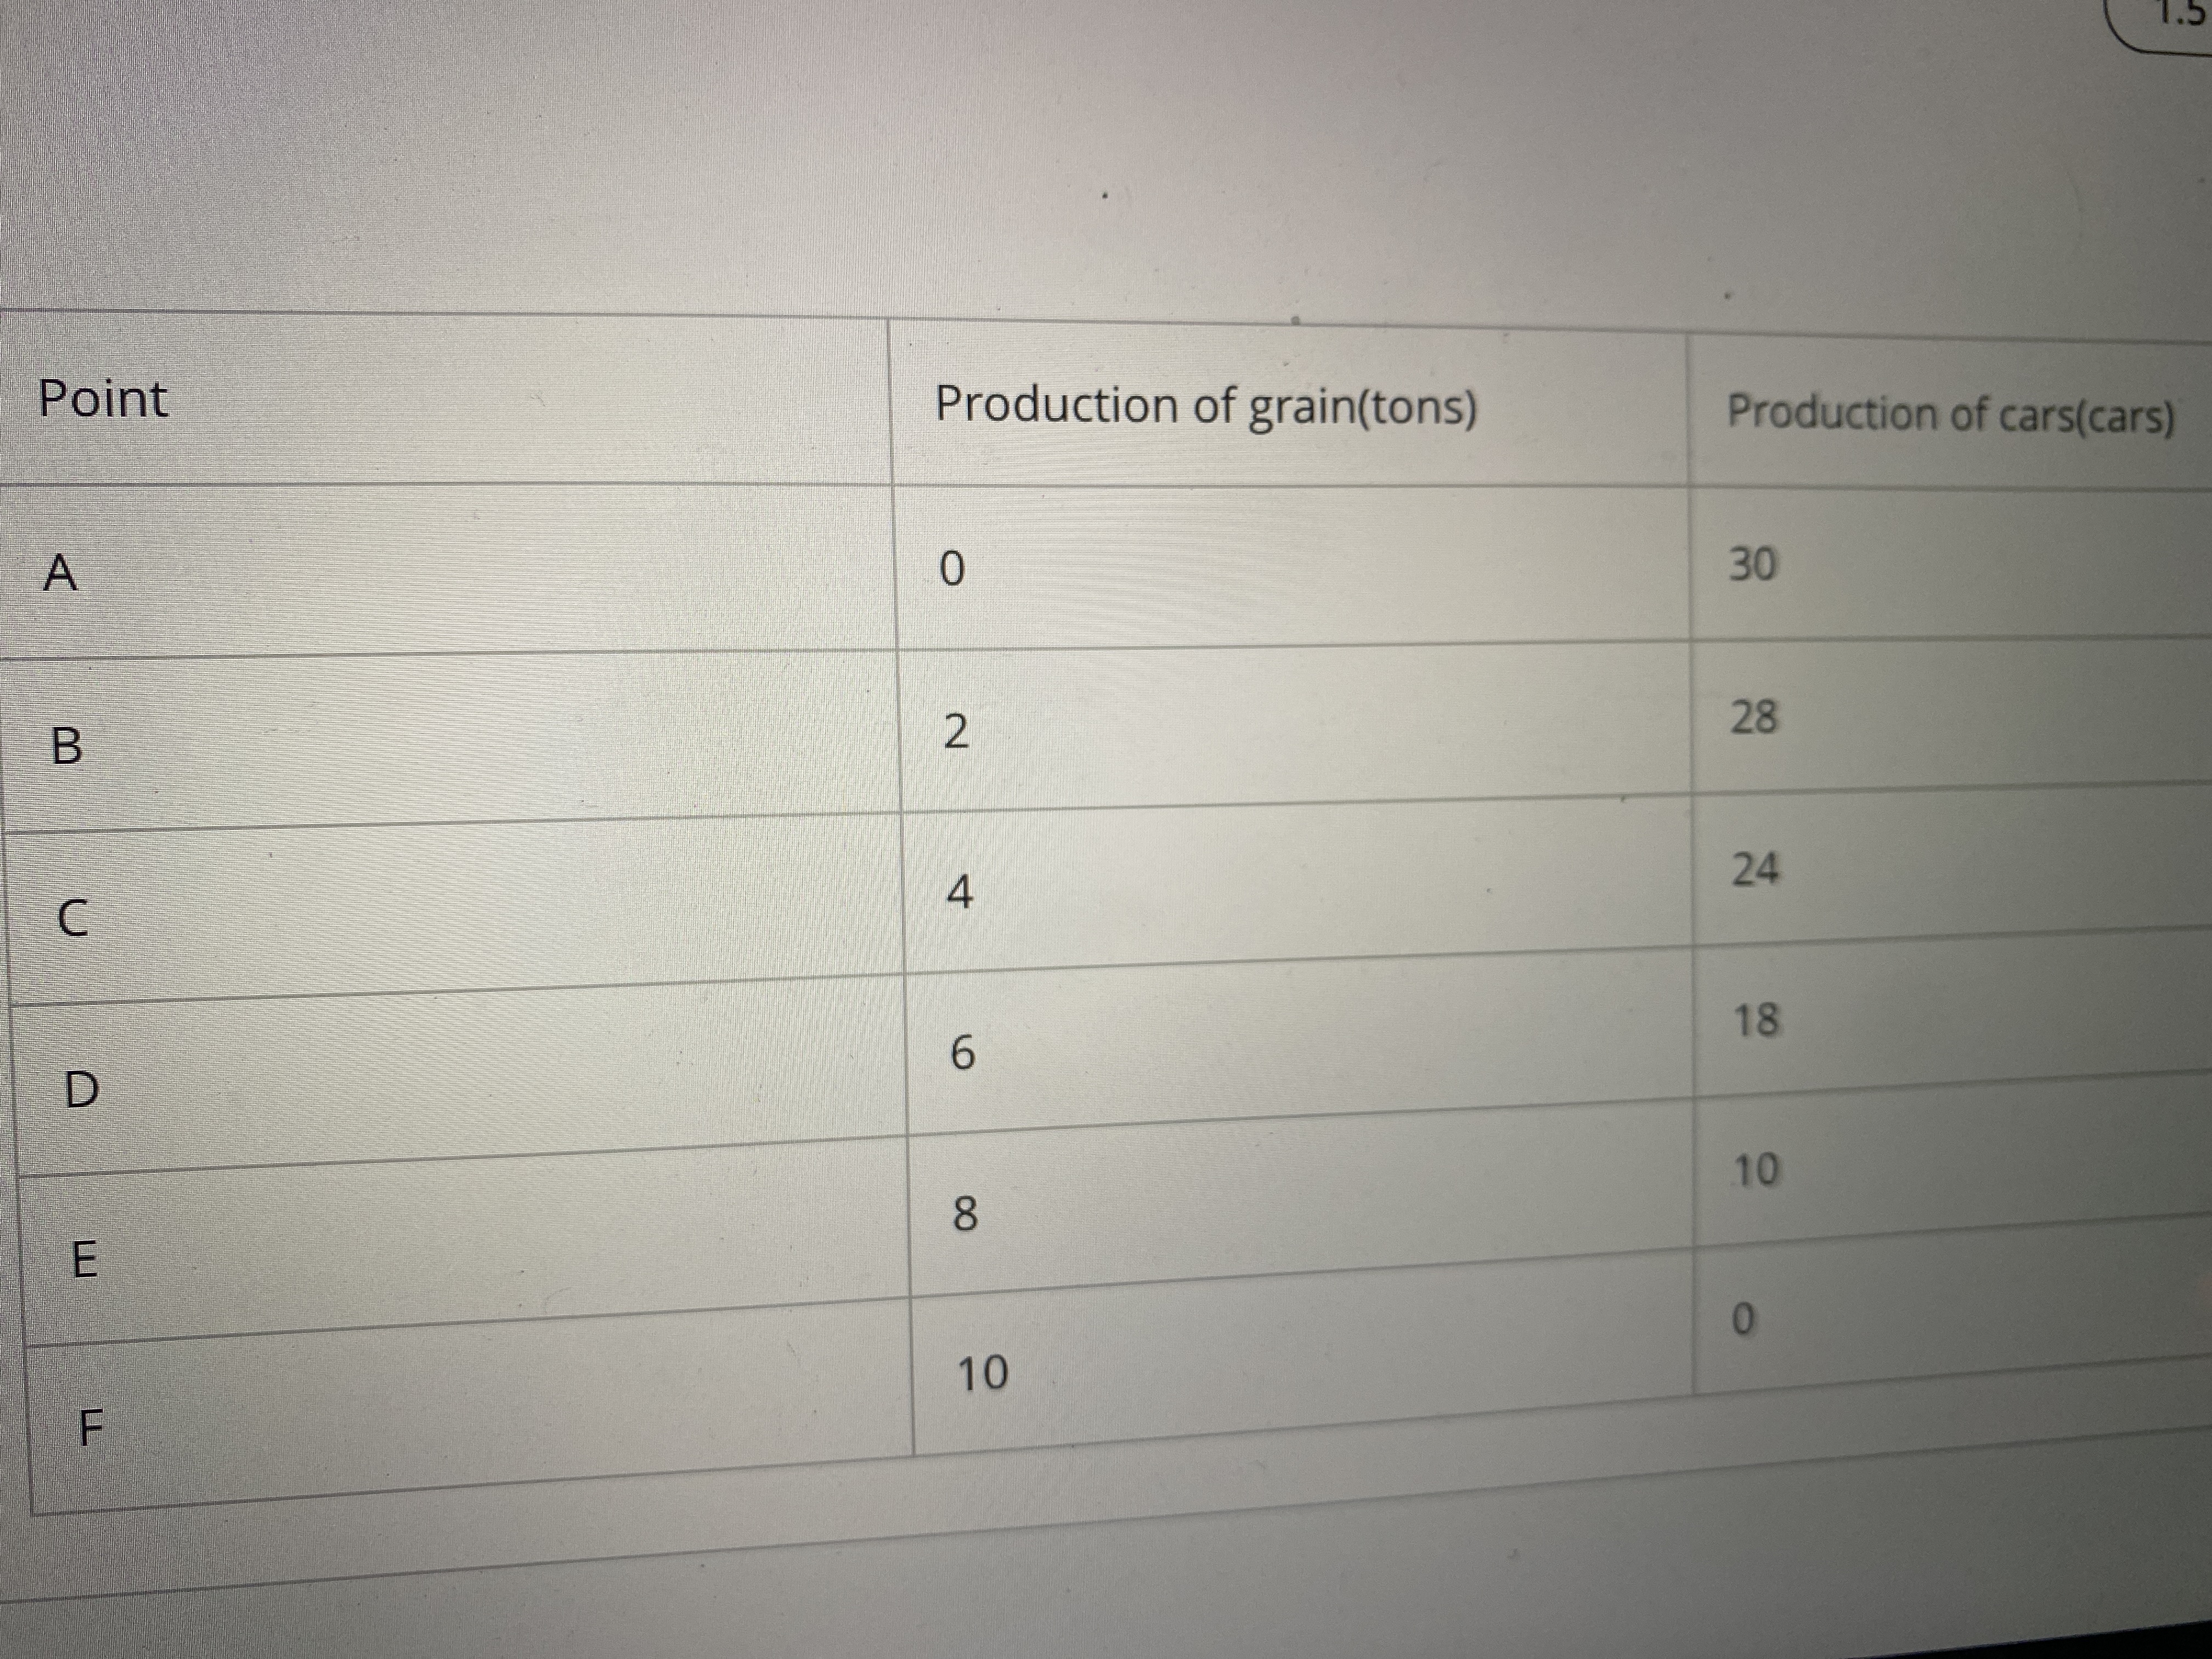
Q12) kindly read the table below and answer it's questions.
(2 attache)
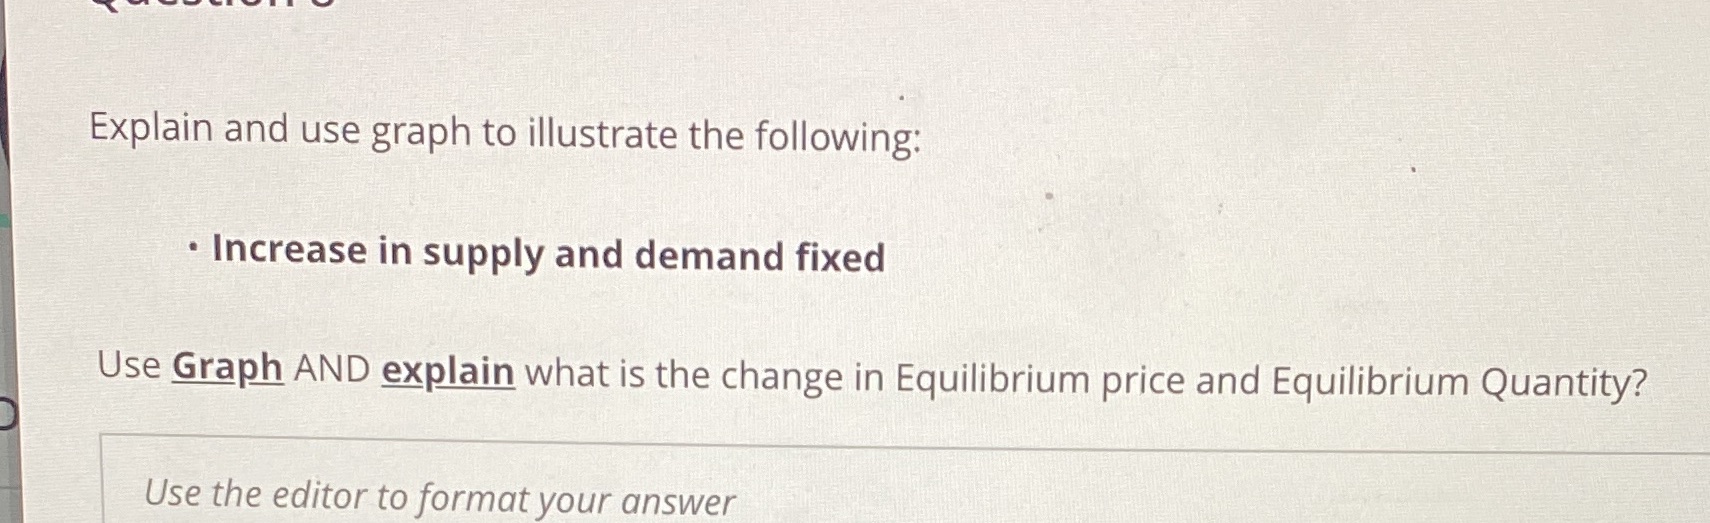
Explain and use graph to illustrate the following: . Increase in supply and demand fixed Use Graph AND explain what is the change in Equilibrium price and Equilibrium Quantity? Use the editor to format your answer
Step by Step Solution
There are 3 Steps involved in it
1 Expert Approved Answer
Step: 1 Unlock

Question Has Been Solved by an Expert!
Get step-by-step solutions from verified subject matter experts
Step: 2 Unlock
Step: 3 Unlock