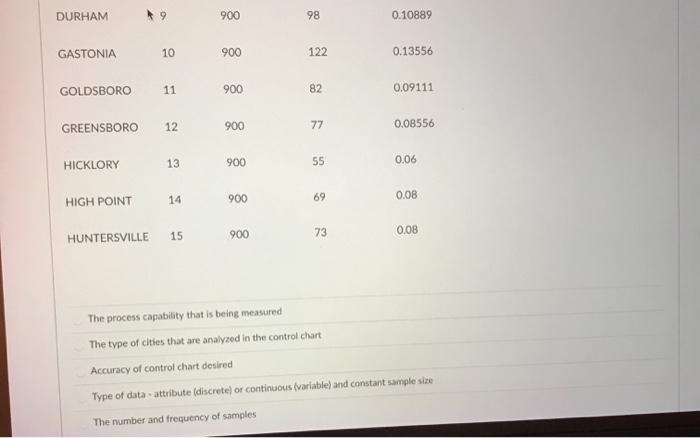
Question: Q16 (The same data / information as previous question). The School of Public Health at UNNCCC collected information from 15 cities / suburbs in NC

Q16 Q16 (The same data / information as previous
Q16 (The same data / information as previous
(The same data / information as previous question). The School of Public Health at UNNCCC collected information from 15 cities / suburbs in NC by noting results of Cavid-19 testing from 900 residents selected at random in each of the following city suburb. The number of residents tested positive for the virus in each sample were noted per the table below. What reasoning is used to identify the appropriate control chart type to be used? City City Sample number Size Number of Residents tested Proportion positive in Defective Sample CARY 1 900 90 0.10000 CATAWBA 2 900 34 0.03778 CHAPEL HILL 3 900 111 0.12333 CHARLOTTE 4 900 50 0.05556 CLEMMONS 5 900 70 0.07778 CONCORD 6 900 99 0.11000 CORNELIUS 7 900 25 0.02778 DAVIDSON 8 900 88 0.09778 DURHAM 9 900 98 0.10889 DURHAM 9 900 98 0.10889 GASTONIA 10 900 122 0.13556 GOLDSBORO 11 900 82 0.09111 GREENSBORO 12 900 77 0.08556 HICKLORY 13 900 0.06 55 14 900 HIGH POINT 69 0.00 15 HUNTERSVILLE 900 73 0.08 The process capability that is being measured The type of cities that are analyzed in the control chart Accuracy of control chart desired Type of data-attribute (discrete) or continuous (variable) and constant sample size The number and frequency of samples

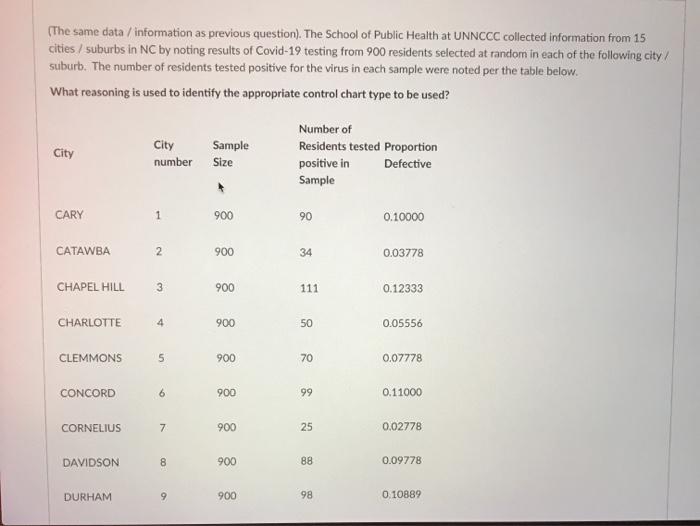
Step by Step Solution

There are 3 Steps involved in it

1 Expert Approved Answer
Step: 1 Unlock blur-text-image
Question Has Been Solved by an Expert!

Get step-by-step solutions from verified subject matter experts

Step: 2 Unlock
Step: 3 Unlock

Students Have Also Explored These Related General Management Questions!