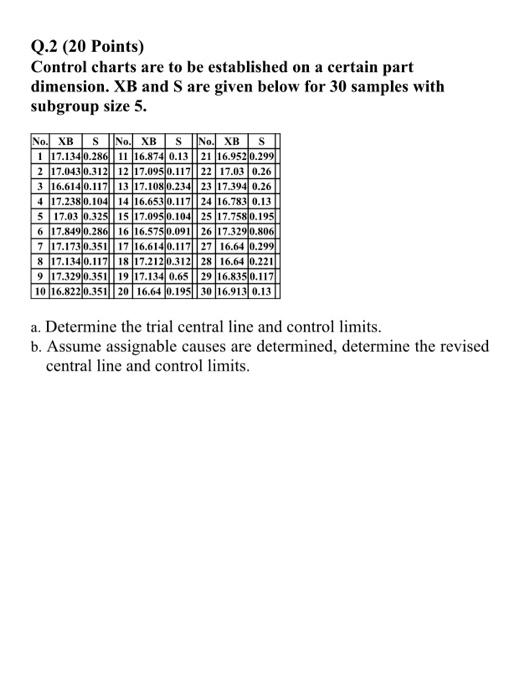
Question: Q.2 (20 Points) Control charts are to be established on a certain part dimension. XB and S are given below for 30 samples with subgroup

Q.2 (20 Points) Control charts are to be
Q.2 (20 Points) Control charts are to be established on a certain part dimension. XB and S are given below for 30 samples with subgroup size 5. No. XB s | No. XBs No. XBS 1 17.1340.286 | 11 16.874 0.13 21 16.952 0.299 2 17.0430.312 12 17.095 0.11722 17.03 0.26 3 16.614 0.11713 17.1080.234|23 17.394 0.26 4 17.238 0.10414 16.653 0.117 24 16.783 0.13 5 17.03 0.325 15 17.095 0.10425 17.7580.195 6 17.8490.286 16 16.5750.091|| 26 17.3290.806 7 17.1730.351 17 16.614 0.11727 16.640.299 8 17.1340.117| 18 17.2120.312 28 16.64 0.221 9 17.329 0.351 19 17.134 0.65 29 16.835 0.117 10 16.822 0.351 20 16.64 0.195|30 16.913 0.13 a. Determine the trial central line and control limits. b. Assume assignable causes are determined, determine the revised central line and control limits

Step by Step Solution

There are 3 Steps involved in it

1 Expert Approved Answer
Step: 1 Unlock blur-text-image
Question Has Been Solved by an Expert!

Get step-by-step solutions from verified subject matter experts

Step: 2 Unlock
Step: 3 Unlock

Students Have Also Explored These Related General Management Questions!