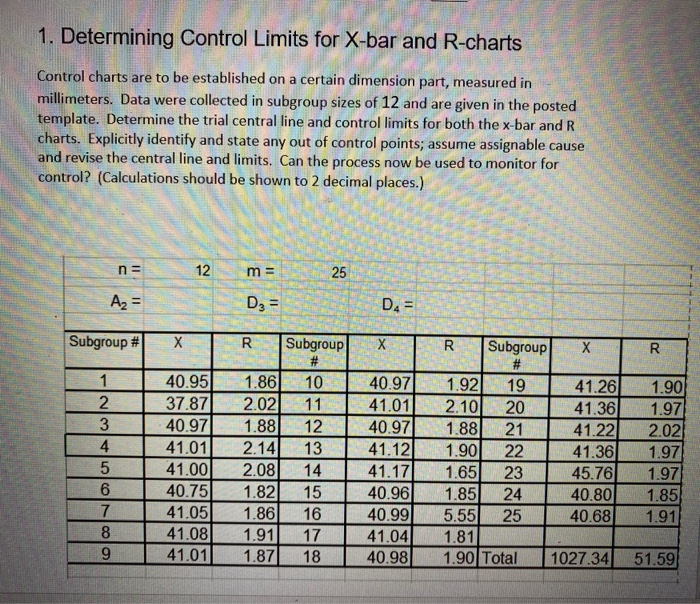
Question: 1. Determining Control Limits for X-bar and R-charts Control charts are to be established on a certain dimension part, measured in millimeters. Data were collected

1. Determining Control Limits for X-bar and
1. Determining Control Limits for X-bar and R-charts Control charts are to be established on a certain dimension part, measured in millimeters. Data were collected in subgroup sizes of 12 and are given in the posted template. Determine the trial central line and control limits for both the x-bar and R charts. Explicitly identify and state any out of control points; assume assignable cause and revise the central line and limits. Can the process now be used to monitor for control? (Calculations should be shown to 2 decimal places.) n = 12 m = 25 Az = D3 = DA= Subgroup # R R Subgroup X R 1 2 3 4 5 6 7 8 9 40.95 37.87 40.97 41.01 41.00 40.75 41.05 41.08 41.01 1.86 2.02 1.88 2.14 2.08 1.82 1.86 1.91 1.87 Subgroup # 10 11 12 13 14 40.97 41.01 40.97 41.12 41.17 40.96 40.99 41.04 40.98 1.92 19 2.10 20 1.88 21 1.90 22 1.65 23 1.85 24 5.55 25 1.81 1.90 Total 41.26 41.36 41.22 41.36 45.76 40.80 40.68 1.90 1.97 2.02) 1.97 1.97 1.85 1.91 15 16 17 18 1027.34 51.591 v m ER, R = m UCLX = + A UCLR D LCLX 3 - AR LCLR D OOC points Revised M , m R; R = m UCLx = ++ AR UCLR = D. LCL 3 - 4 LCLR = DR The process can now be monitored for control because all of the remaining points fall within the control limits

Step by Step Solution

There are 3 Steps involved in it

1 Expert Approved Answer
Step: 1 Unlock blur-text-image
Question Has Been Solved by an Expert!

Get step-by-step solutions from verified subject matter experts

Step: 2 Unlock
Step: 3 Unlock

Students Have Also Explored These Related General Management Questions!