

Question: Q2. (25 marks) Explain the graph given below in context of our lecture discussion. Average annual standard deviation (%) 49.2 Diversifiable risk 23.9 19.2 Nondiversifiable
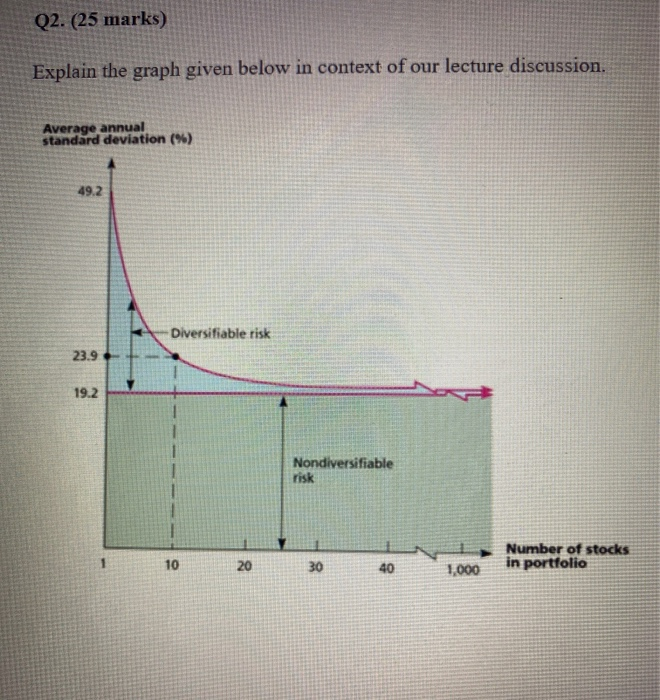
Q2. (25 marks) Explain the graph given below in context of our lecture discussion. Average annual standard deviation (%) 49.2 Diversifiable risk 23.9 19.2 Nondiversifiable risk Number of stocks in portfolio 10 20 30 40 1,000
Step by Step Solution
There are 3 Steps involved in it
1 Expert Approved Answer
Step: 1 Unlock

Question Has Been Solved by an Expert!
Get step-by-step solutions from verified subject matter experts
Step: 2 Unlock
Step: 3 Unlock