

Question: Q2 4 points Conduct pairwise comparisons between the Fat levels, averaging over the two cooking Methods, and summarize the result using an underline diagram. Please
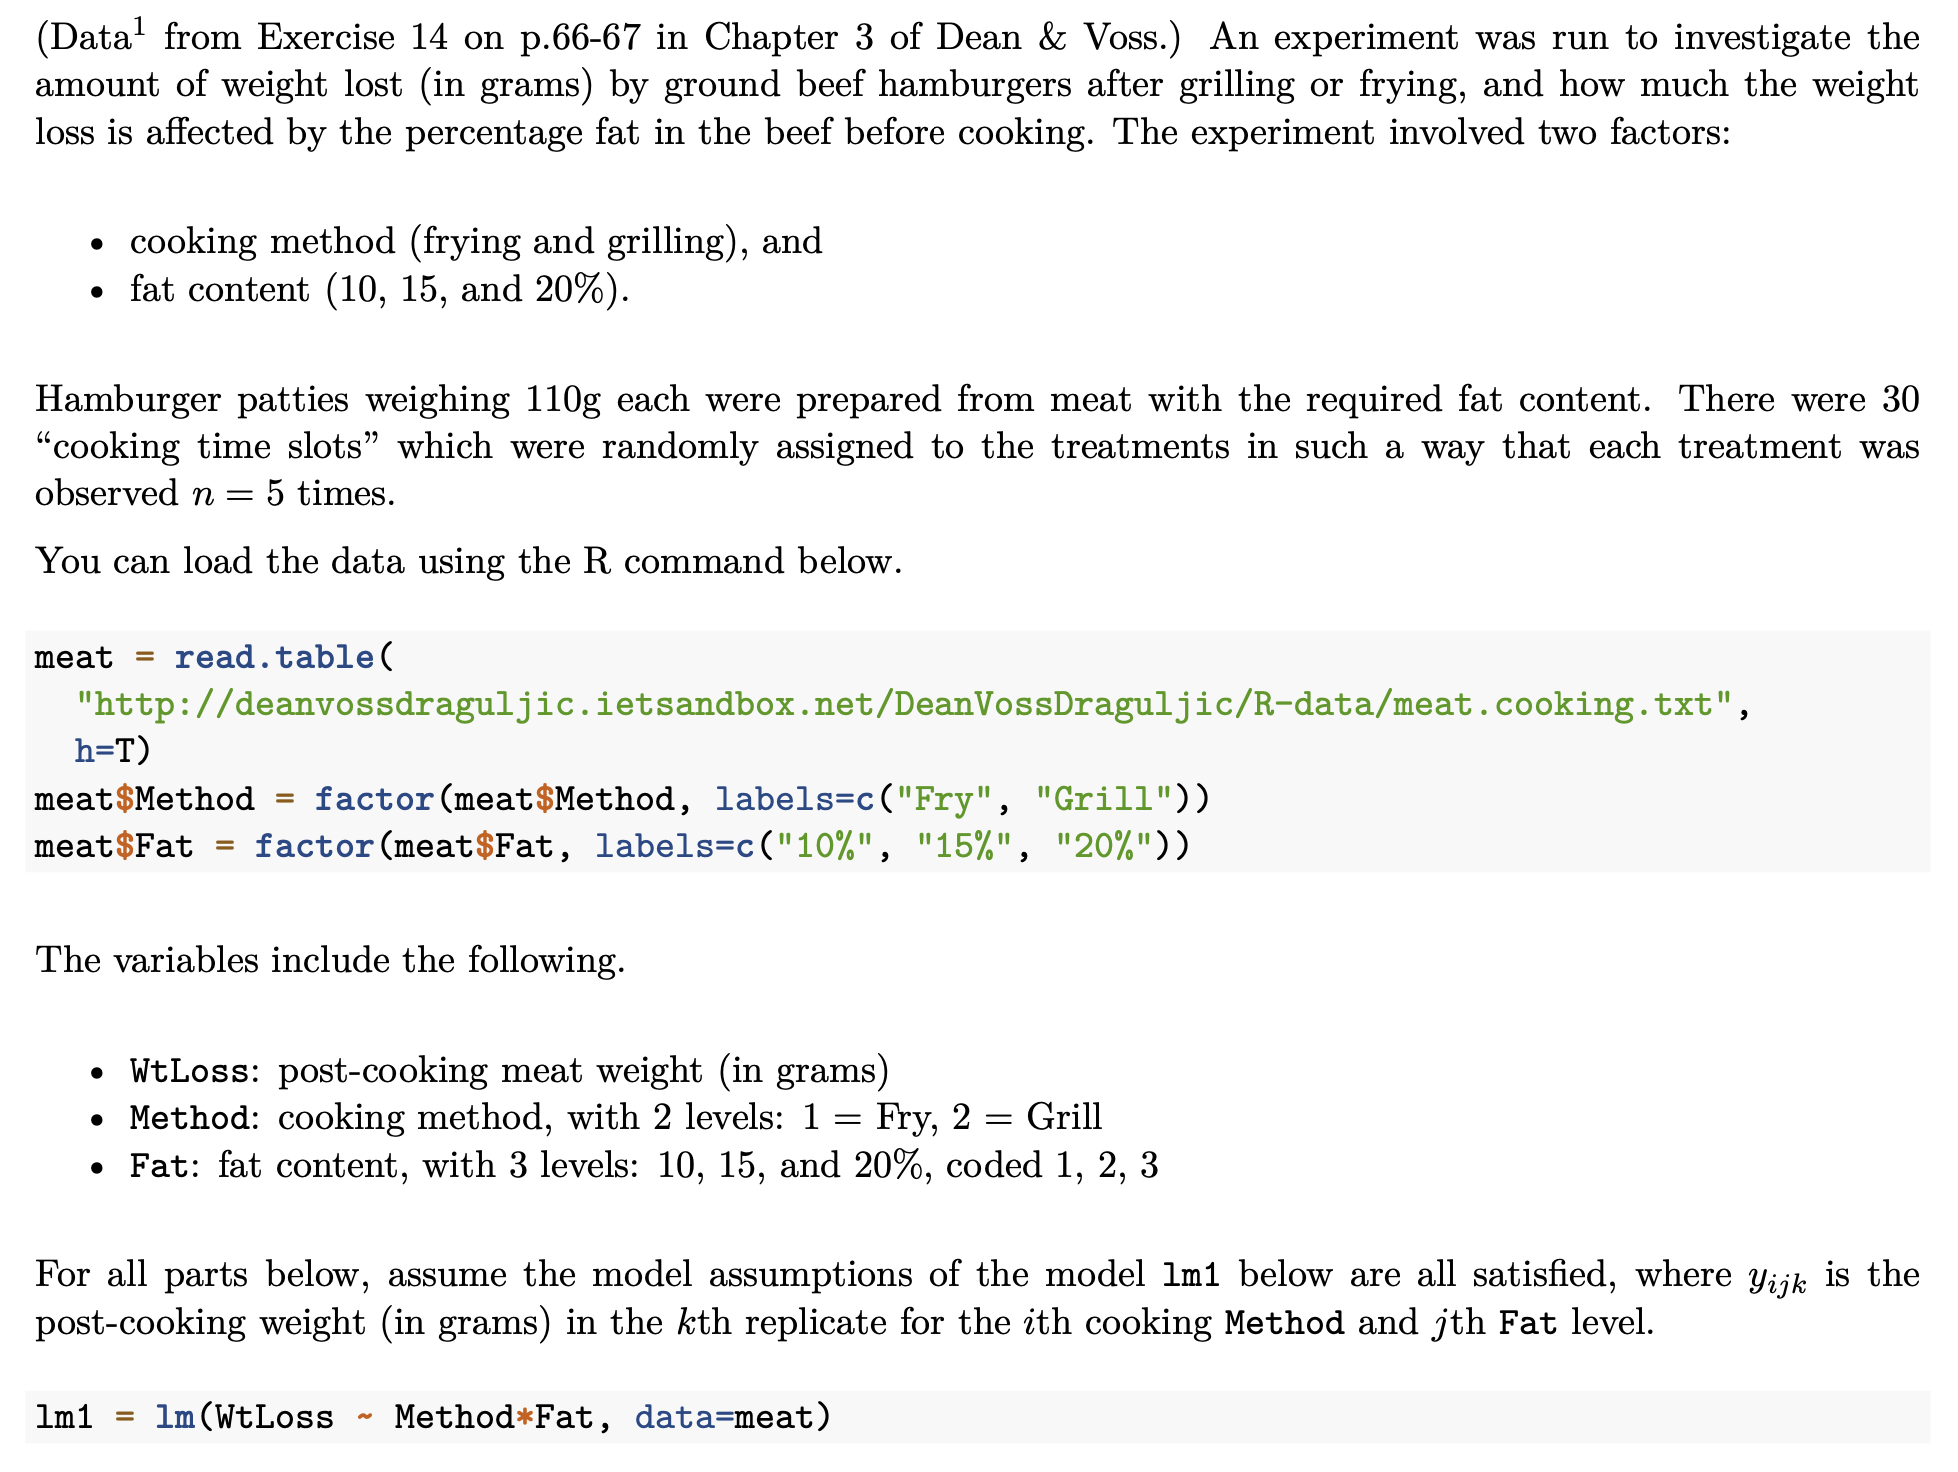
Q2 4 points Conduct pairwise comparisons between the Fat levels, averaging over the two cooking Methods, and summarize the result using an underline diagram. Please control the FWER of your analysis in Q2 at 0.02. Which multiple comparison method would you use to control the FWER? (Data! from Exercise 14 on p.66-67 in Chapter 3 of Dean & Voss.) An experiment was run to investigate the amount of weight lost (in grams) by ground beef hamburgers after grilling or frying, and how much the weight loss is affected by the percentage fat in the beef before cooking. The experiment involved two factors: cooking method (frying and grilling), and o fat content (10, 15, and 20%). Hamburger patties weighing 110g each were prepared from meat with the required fat content. There were 30 \"cooking time slots\" which were randomly assigned to the treatments in such a way that each treatment was observed n = 5 times. You can load the data using the R command below. meat = read.table( "http://deanvossdraguljic.ietsandbox.net/DeanVossDraguljic/R-data/meat.cooking. txt", h=T) meat$Method = factor(meat$Method, labels=c("Fry", "Grill")) meat$Fat = factor(meat$Fat, labels=c("10%", "15%", "20%")) The variables include the following. WtLoss: post-cooking meat weight (in grams) e Method: cooking method, with 2 levels: 1 = Fry, 2 = Grill o Fat: fat content, with 3 levels: 10, 15, and 20%, coded 1, 2, 3 For all parts below, assume the model assumptions of the model 1m1l below are all satisfied, where y;; is the post-cooking weight (in grams) in the kth replicate for the ith cooking Method and jth Fat level. Iml = Im(WtLoss ~ Method*Fat, data=meat)
Step by Step Solution
There are 3 Steps involved in it

Get step-by-step solutions from verified subject matter experts