

Question: - Q2. (5 marks) In the code cell below, write a Python script to plot the function y = f(x) over a range of x
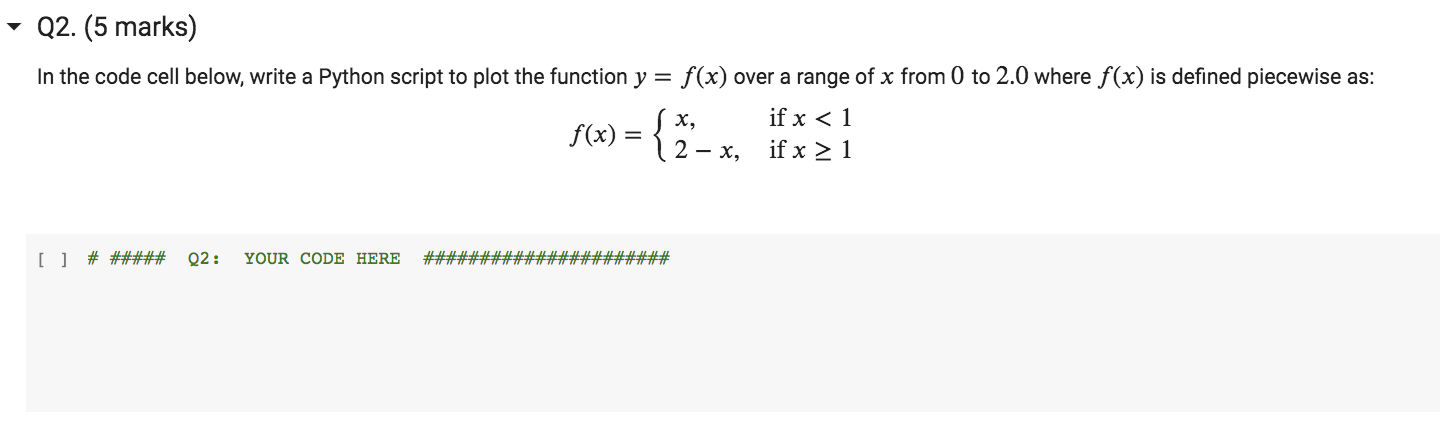
- Q2. (5 marks) In the code cell below, write a Python script to plot the function y = f(x) over a range of x from 0 to 2.0 where f(x) is defined piecewise as: f(x) = { *, if x 1 [ ] # ##### 02: YOUR CODE HERE ######################
Step by Step Solution
There are 3 Steps involved in it
1 Expert Approved Answer
Step: 1 Unlock

Question Has Been Solved by an Expert!
Get step-by-step solutions from verified subject matter experts
Step: 2 Unlock
Step: 3 Unlock