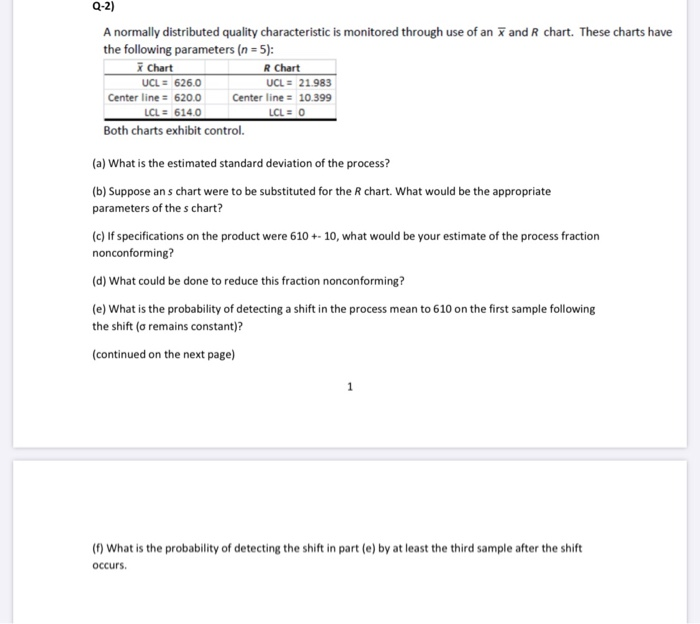
Question: Q-2) and R chart. These charts have A normally distributed quality characteristic is monitored through use of an the following parameters (n = 5): X

Q-2) and R chart. These charts have A normally
Q-2) and R chart. These charts have A normally distributed quality characteristic is monitored through use of an the following parameters (n = 5): X Chart R Chart UCL = 626.0 UCL = 21.983 Center line = 620.0 Center line = 10.399 | LC1= 6140 | C = 0 Both charts exhibit control. (a) What is the estimated standard deviation of the process? (b) Suppose ans chart were to be substituted for the R chart. What would be the appropriate parameters of the s chart? (c) If specifications on the product were 610 +- 10, what would be your estimate of the process fraction nonconforming? (d) What could be done to reduce this fraction nonconforming? (e) What is the probability of detecting a shift in the process mean to 610 on the first sample following the shift (o remains constant)? (continued on the next page) (0) What is the probability of detecting the shift in part (e) by at least the third sample after the shift occurs

Step by Step Solution

There are 3 Steps involved in it

1 Expert Approved Answer
Step: 1 Unlock blur-text-image
Question Has Been Solved by an Expert!

Get step-by-step solutions from verified subject matter experts

Step: 2 Unlock
Step: 3 Unlock

Students Have Also Explored These Related General Management Questions!