

Question: Q2. Examine the graph. a) This graph does not start at the origin. What does this tell you about the position of the object
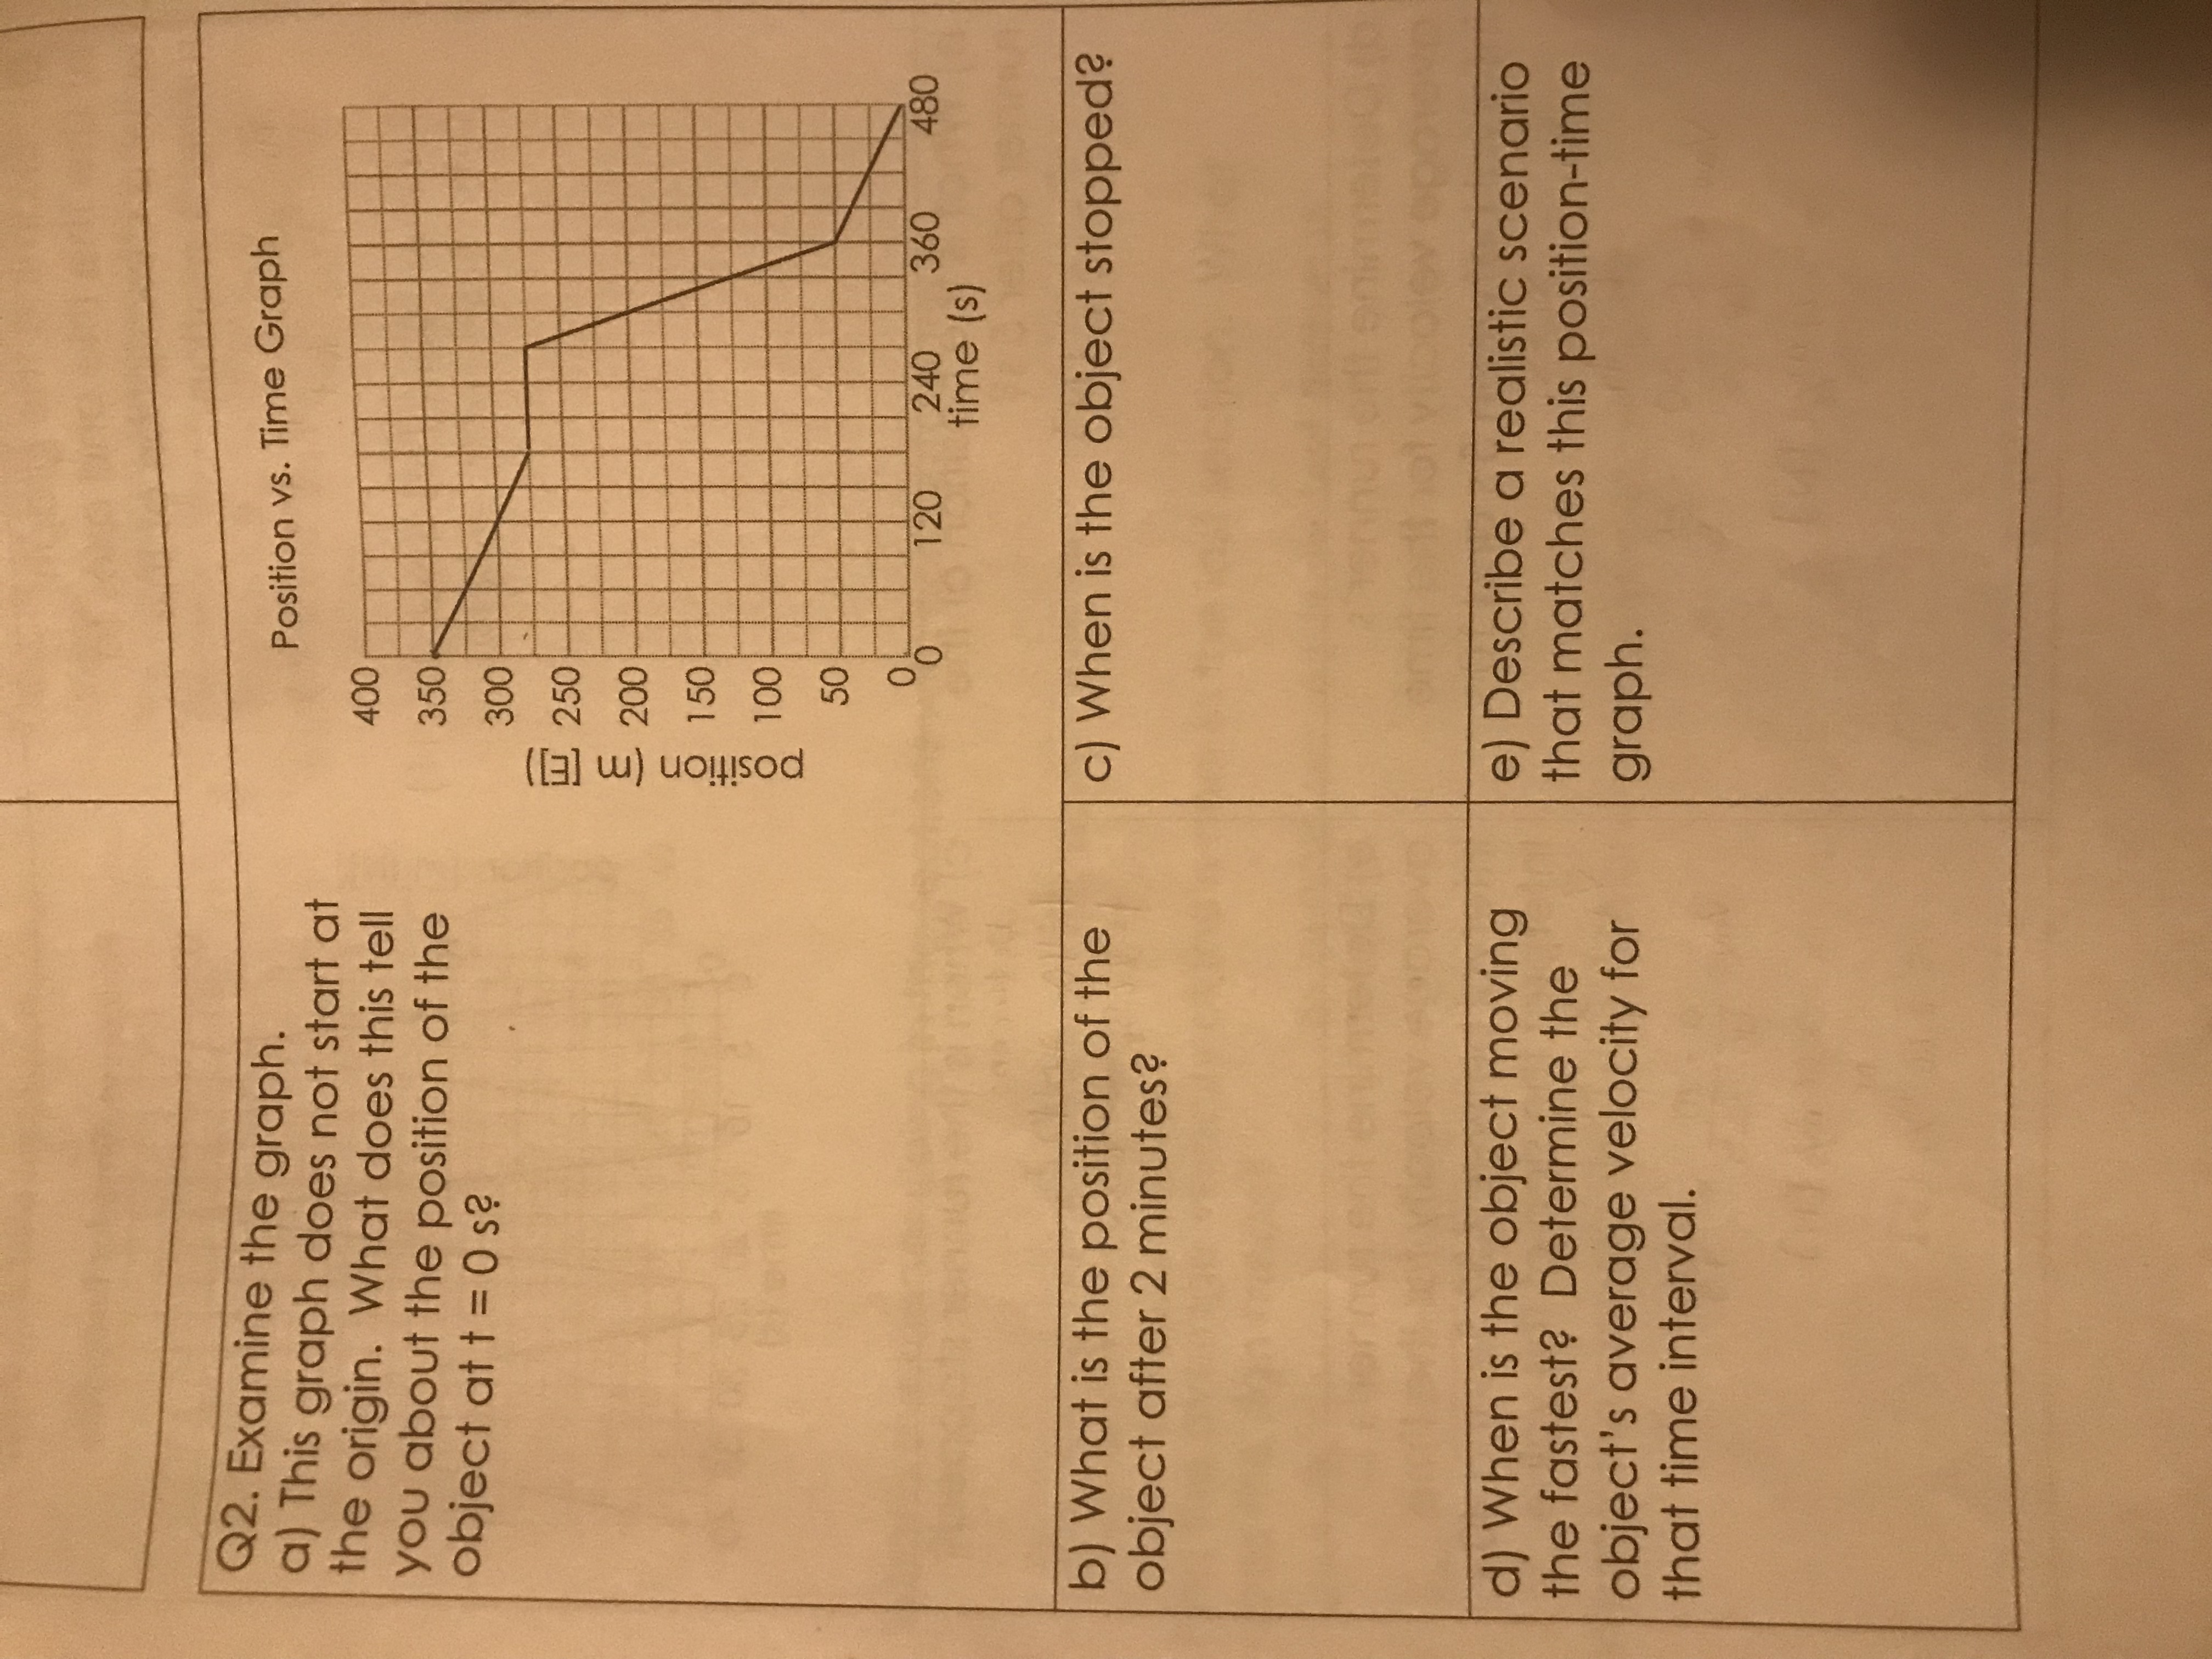
Q2. Examine the graph. a) This graph does not start at the origin. What does this tell you about the position of the object at t = 0 s? 400 350 Position vs. Time Graph 300 position (m [E]) 250 200 150 100 50 50 0. 120 240 time (s) 360 480 b) What is the position of the object after 2 minutes? c) When is the object stopped? d) When is the object moving the fastest? Determine the object's average velocity for that time interval. e) Describe a realistic scenario that matches this position-time graph.
Step by Step Solution
There are 3 Steps involved in it
1 Expert Approved Answer
Step: 1 Unlock

Question Has Been Solved by an Expert!
Get step-by-step solutions from verified subject matter experts
Step: 2 Unlock
Step: 3 Unlock