

Question: # PAIMAI Year 2017 2018 2019 2020 2021 2022 2023 2024 If you got the following values of the sales of the number of
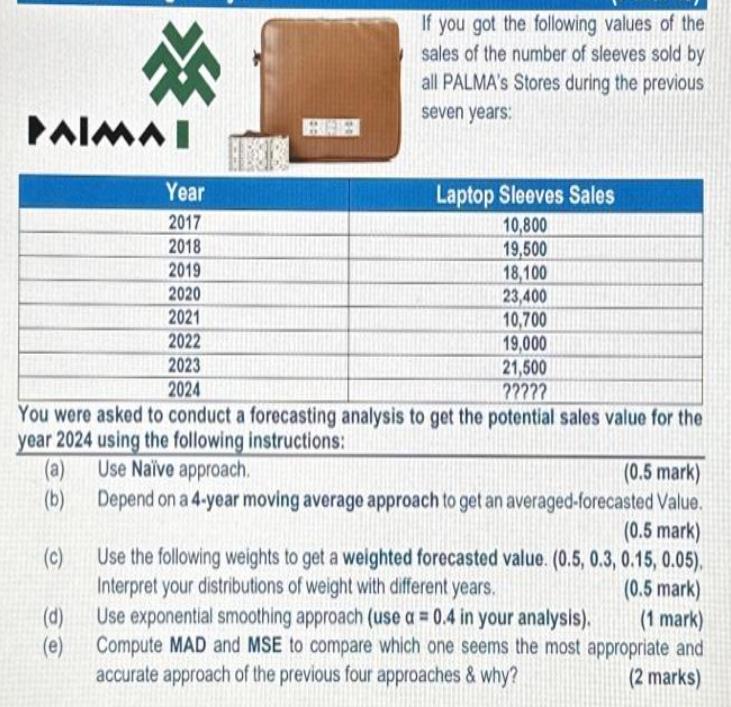
# PAIMAI Year 2017 2018 2019 2020 2021 2022 2023 2024 If you got the following values of the sales of the number of sleeves sold by all PALMA's Stores during the previous seven years: Laptop Sleeves Sales 10,800 19,500 18,100 23,400 10,700 19,000 21,500 ????? You were asked to conduct a forecasting analysis to get the potential sales value for the year 2024 using the following instructions: (a) Use Nave approach. (0.5 mark) (b) Depend on a 4-year moving average approach to get an averaged-forecasted Value. (0.5 mark) (c) Use the following weights to get a weighted forecasted value. (0.5, 0.3, 0.15, 0.05). Interpret your distributions of weight with different years. (0.5 mark) (d) (1 mark) (e) Use exponential smoothing approach (use a = 0.4 in your analysis). Compute MAD and MSE to compare which one seems the most appropriate and accurate approach of the previous four approaches & why? (2 marks)
Step by Step Solution
There are 3 Steps involved in it
ANSWER Q2 Forecasting Analysis If you got the following values of the sales of the number of sleeves sold by all PALMAs Stores during the previous sev... View full answer

Get step-by-step solutions from verified subject matter experts