

Question: Q2 In figure I which quantities have the same value in both plots. Fig 1 4.0 T= 80 K 3.0 2.0 T= 300 K 1.0
Q2 In figure I which quantities have the same value in both plots.
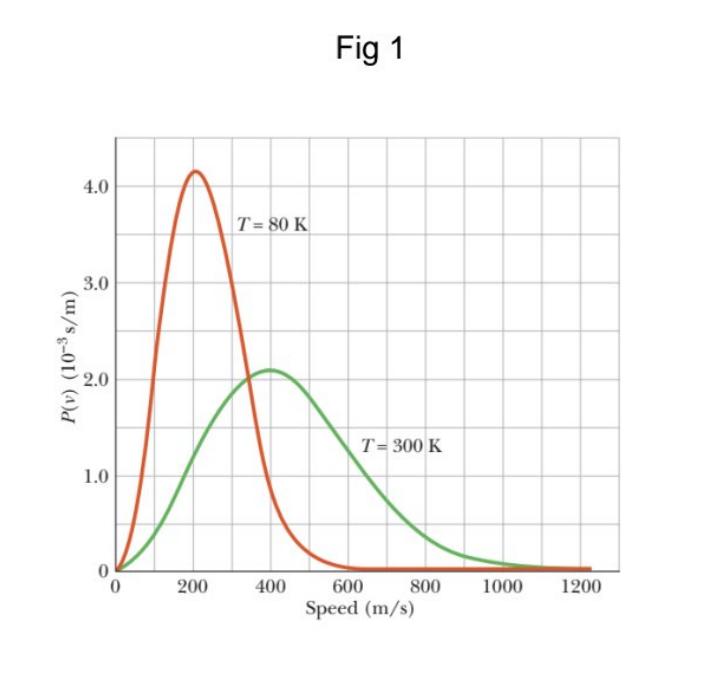
Fig 1 4.0 T= 80 K 3.0 2.0 T= 300 K 1.0 200 400 600 800 1000 1200 Speed (m/s) P(v) (10-s/m)
Step by Step Solution
★★★★★
3.49 Rating (159 Votes )
There are 3 Steps involved in it
1 Expert Approved Answer
Step: 1 Unlock

Please ... View full answer
Question Has Been Solved by an Expert!
Get step-by-step solutions from verified subject matter experts
Step: 2 Unlock
Step: 3 Unlock
Document Format (2 attachments)
63655e270fa3c_240248.pdf
180 KBs PDF File
63655e270fa3c_240248.docx
120 KBs Word File