

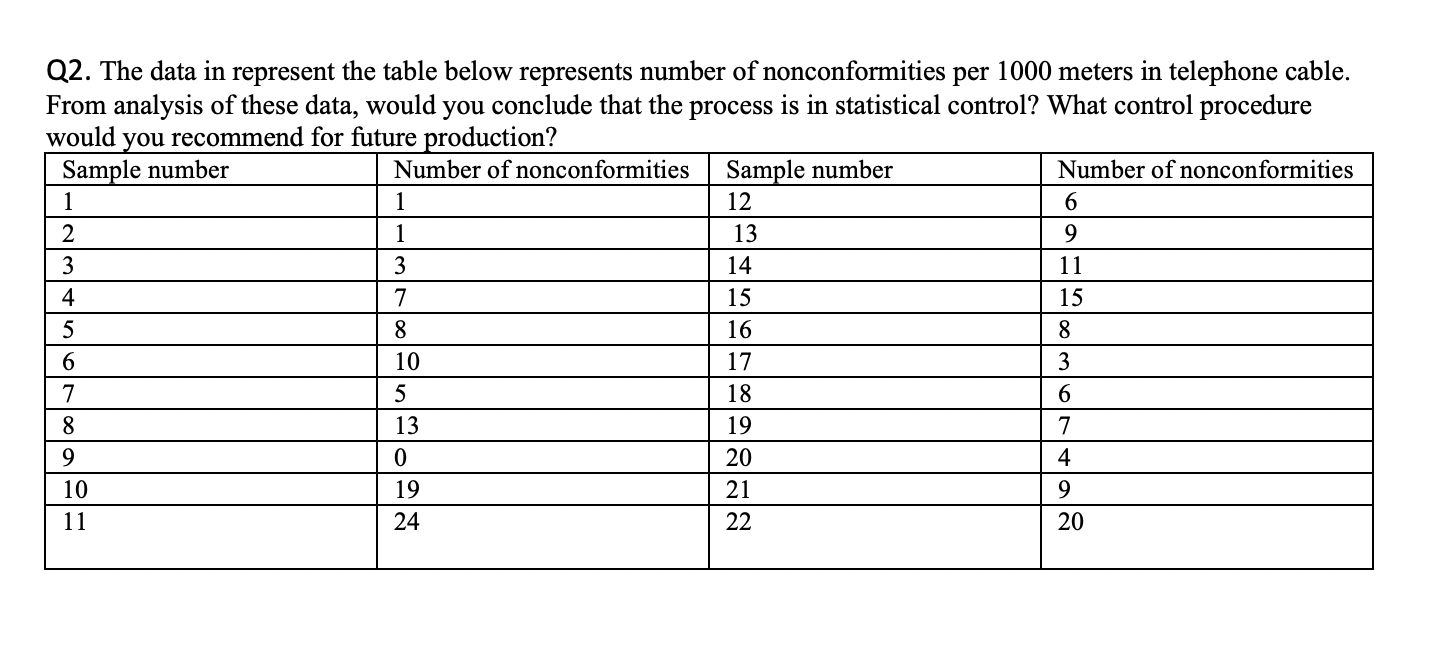
Question: Q2. The data in represent the table below represents number of nonconformities per 1000 meters in telephone cable. From analysis of these data, would you
Step by Step Solution
There are 3 Steps involved in it
1 Expert Approved Answer
Step: 1 Unlock

Question Has Been Solved by an Expert!
Get step-by-step solutions from verified subject matter experts
Step: 2 Unlock
Step: 3 Unlock