

Question: Q2. Using the data given, find the best polynomial fit for the data. Compare your answer with Excel Calculations. 2.5 Marks This data set of
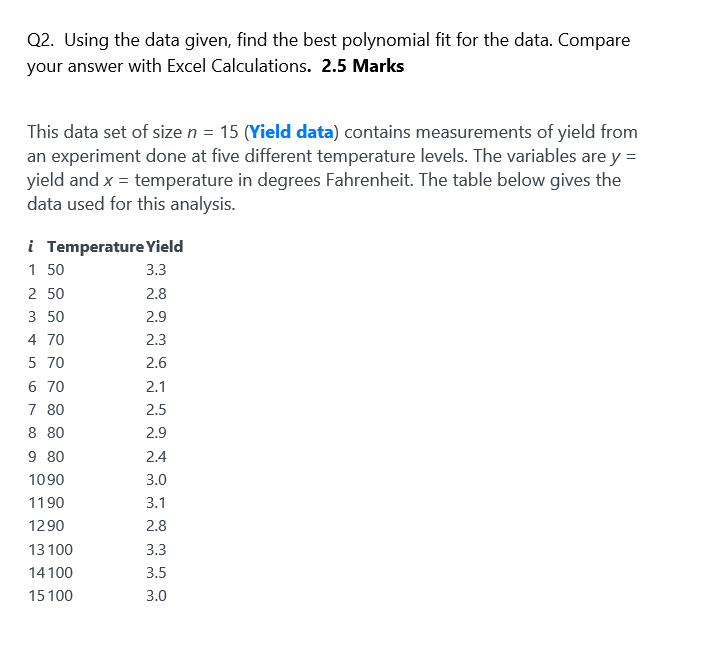
Q2. Using the data given, find the best polynomial fit for the data. Compare your answer with Excel Calculations. 2.5 Marks This data set of size n = 15 (Yield data) contains measurements of yield from an experiment done at five different temperature levels. The variables are y = yield and x = temperature in degrees Fahrenheit. The table below gives the data used for this analysis. 2.8 i Temperature Yield 1 50 3.3 2 50 3 50 2.9 4 70 2.3 5 70 2.6 6 70 2.1 7 80 2.5 8 80 2.9 9 80 2.4 1090 3.0 1190 3.1 1290 2.8 13 100 3.3 14100 3.5 15 100 3.0
Step by Step Solution
There are 3 Steps involved in it
1 Expert Approved Answer
Step: 1 Unlock

Question Has Been Solved by an Expert!
Get step-by-step solutions from verified subject matter experts
Step: 2 Unlock
Step: 3 Unlock