

Question: Q2. Using the data in the table below, Plot the water saturation profile as a function of distance. Swf=0.55 Kro/krw=29 @ sw=0.23 1-sor=0.8 Kro/krw=0.15 @
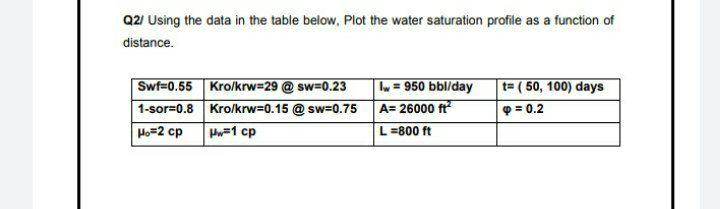
Q2. Using the data in the table below, Plot the water saturation profile as a function of distance. Swf=0.55 Kro/krw=29 @ sw=0.23 1-sor=0.8 Kro/krw=0.15 @ sw=0.75 Ho=2 cp Ww=1 cp 1 = 950 bbl/day A=26000 ft L =800 ft t= ( 50, 100) days P = 0.2 Q2. Using the data in the table below, Plot the water saturation profile as a function of distance. Swf=0.55 Kro/krw=29 @ sw=0.23 1-sor=0.8 Kro/krw=0.15 @ sw=0.75 Ho=2 cp Ww=1 cp 1 = 950 bbl/day A=26000 ft L =800 ft t= ( 50, 100) days P = 0.2
Step by Step Solution
There are 3 Steps involved in it
1 Expert Approved Answer
Step: 1 Unlock

Question Has Been Solved by an Expert!
Get step-by-step solutions from verified subject matter experts
Step: 2 Unlock
Step: 3 Unlock