

Question: Q2: We will add a new variable to the analysis of problem Q1, namely PriceDiff (sale price of MM less sale price of CH) (a)
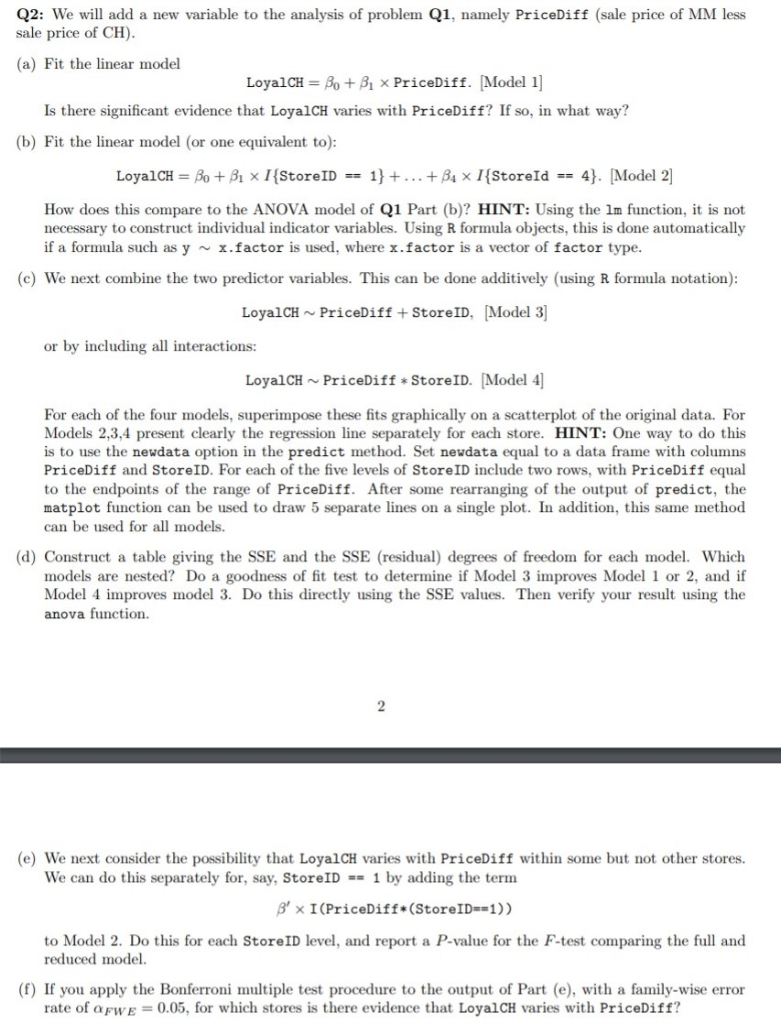
Q2: We will add a new variable to the analysis of problem Q1, namely PriceDiff (sale price of MM less sale price of CH) (a) Fit the linear model LoyalCH-Au+A x PriceDiff. [Model 1] Is there significant evidence that LoyalCH varies with PriceDiff? If so, in what way? (b) Fit the linear model (or one equivalent to) How does this compare to the ANOVA model of Q1 Part (b)? HINT: Using the 1m function, t is not necessary to construct individual indicator variables. Using R formula objects, this is done automatically if a formula such as y x.factor is used, where x.factor is a vector of factor type. (c) We next combine the two predictor variables. This can be done additively (using R formula notation) LoyalCH~ PriceDiff +StoreID, Model 3] or by including al interactions: LoyalCH PriceDiff StoreID. Model 4 For each of the four models, superimpose these fits graphically on a scatterplot of the original data. For Models 2,3,4 present clearly the regression line separately for each store. HINT: One way to do this is to use the newdata option in the predict method. Set neudata equal to a data frame with columns PriceDiff and StoreID. For each of the five levels of StoreID include two rows, with PriceDiff equal to the endpoints of the range of PriceDiff. After some rearranging of the output of predict, the matplot function can be used to draw 5 separate lines on a single plot. In addition, this same method can be used for all models. (d) Construct a table giving the SSE and the SSE (residual) degrees of freedom for each model. Which models are nested? Do a goodness of fit test to determine if Model 3 improves Model 1 or 2, and if Model 4 improves model 3. Do this directly using the SSE values. Then verify your result using the anova function. 2 (e) We next consider the possibility that LoyalCH varies with PriceDiff within some but not other stores. We can do this separately for, say, Store!D #-1 by adding the term , x 1 (PriceDiffe(Store!Dm1)) to Model 2. Do this for each StoreID level, and report a P-value for the F-test comparing the full and reduced model. (f) If you apply the Bonferroni multiple test procedure to the output of Part (e), with a family-wise error rate of aFWE-0.05, for which stores is there evidence that LoyalCH varies with PriceDiff
Step by Step Solution
There are 3 Steps involved in it

Get step-by-step solutions from verified subject matter experts