

Question: Q2. Which stock is riskier based on the returns in the past 10 years? Use your financial calculator and type in the detailed calculator solutions.
Q2. Which stock is riskier based on the returns in the past 10 years? Use your financial calculator and type in the detailed calculator solutions.
Q3. You formed a portfolio when you invested in both stocks? What type of risk are you diversifying away? Use an example to illustrate this type of risk.
Reference:
Simple:
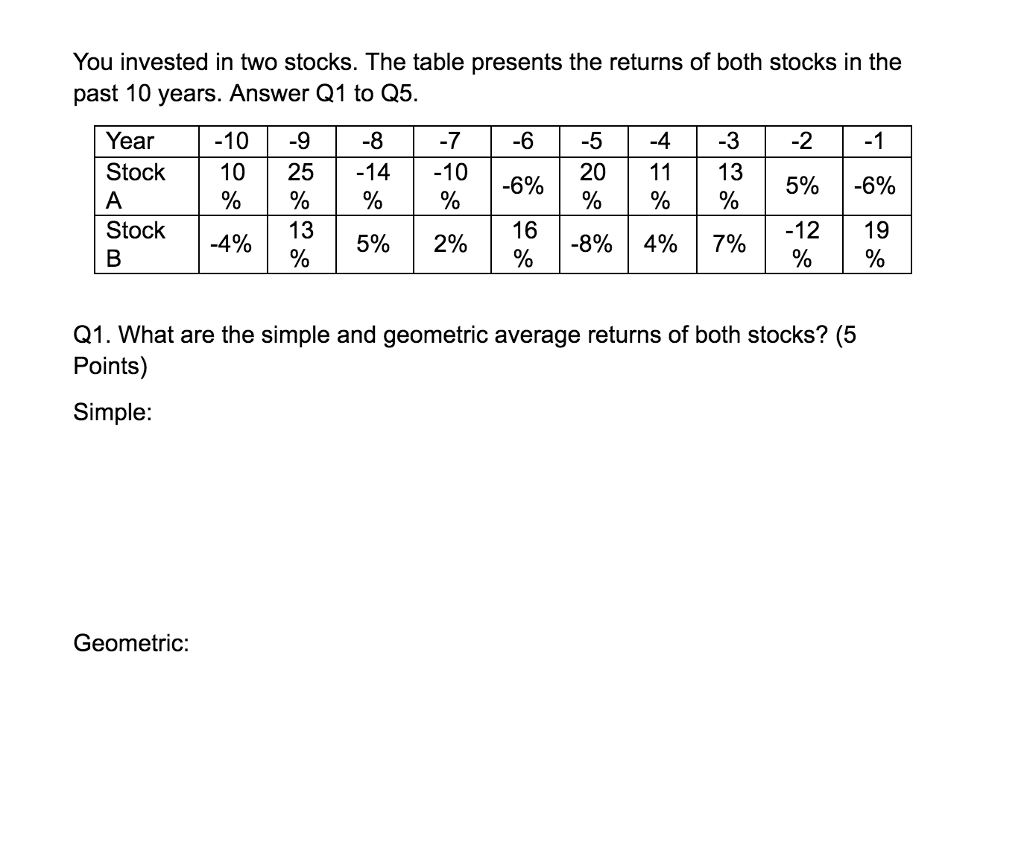
Stock A: (10% + 25% - 14% - 10% - 6% + 20 % +11% + 13% + 5% - 6%) / 10= 4.80%
Stock B: (-4% + 13% + 5% + 2% + 16% - 8% + 4% + 7% - 12% + 19%) / 10= 4.20%
Geometric:
Stock A: ((1 + 10 % ) * (1 + 25%) * (1 - 14%) * (1 - 10%) * (1 - 6%) * (1 + 20%) * (1 + 11%) * (1 + 13%) * (1 + 5%) * (1 - 6%))^(1/10) - 1 = 4.04%
Stock B: ((1 - 4%) * (1 + 13%) * (1 + 5%) * (1 + 2%) * (1 + 16%) * (1 - 8%) * (1 + 4%) * (1 + 7%) * (1 - 12%) * (1 + 19%))^(1/10) - 1= 3.75%
You invested in two stocks. The table presents the returns of both stocks in the past 10 years. Answer Q1 to Q5. -9 -7 -6 -4 -2 -1 Year Stock -10 10 % -8 -14 % 20 -3 13 25 % 11 -10 % -6% 5% -6% A % % o/% Stock 13 16 5% -4% 5% 2% | 16 -8% 4% 7% -12 | 19 19 olo 2% -8% 4% 7% -12 % olo olo Q1. What are the simple and geometric average returns of both stocks? (5 Points) Simple: Geometric
Step by Step Solution
There are 3 Steps involved in it

Get step-by-step solutions from verified subject matter experts