

Question: Q2)(a) Table 3 gives the data for actual demand (D) and forecasted demand (F) of a product for the past 10 months. Using the data
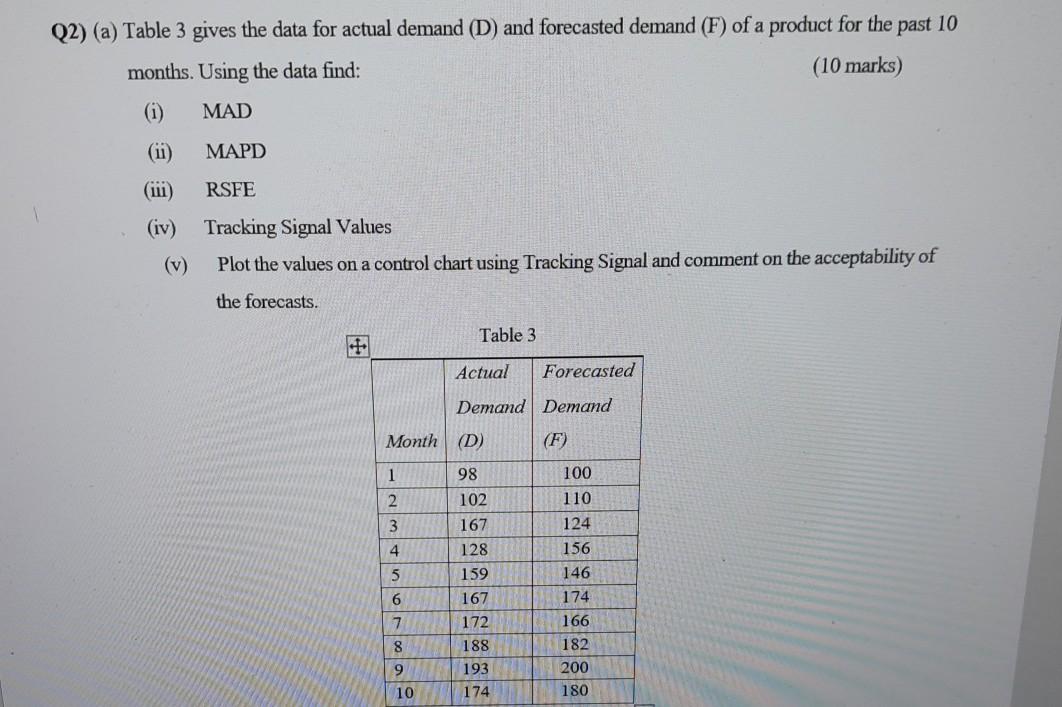
Q2)(a) Table 3 gives the data for actual demand (D) and forecasted demand (F) of a product for the past 10 months. Using the data find: (10 marks) MAD MAPD RSFE (iv) (v) Tracking Signal Values Plot the values on a control chart using Tracking Signal and comment on the acceptability of the forecasts. Table 3 Actual Forecasted Demand Demand Month (D) 100 1 2 3 4 98 102 167 128 159 167 172 188 193 174 110 124 156 146 174 166 5 6 7 8 182 200 9 10 180
Step by Step Solution
There are 3 Steps involved in it
1 Expert Approved Answer
Step: 1 Unlock

Question Has Been Solved by an Expert!
Get step-by-step solutions from verified subject matter experts
Step: 2 Unlock
Step: 3 Unlock