

Question: Q3 ( 30 points ) You are an analyst at an asset management fund. The fund currently has five bonds in its portfolio with the
Q3(30 points) You are an analyst at an asset management fund. The fund currently has five bonds in its portfolio with the attributes shown below.
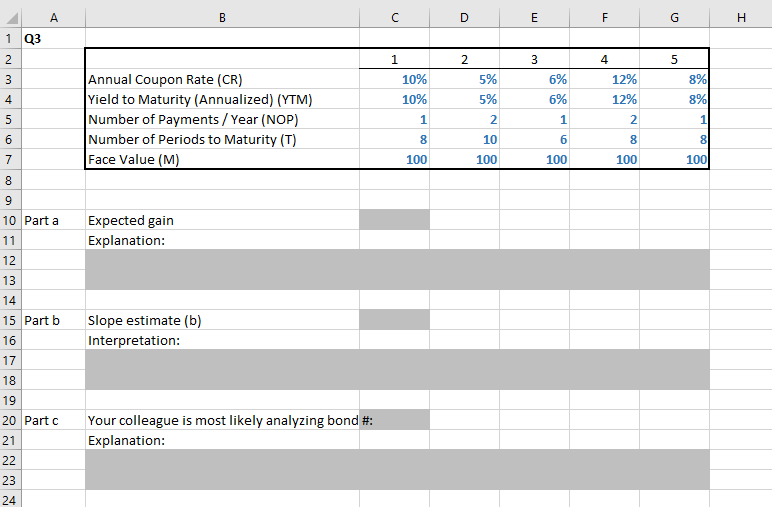
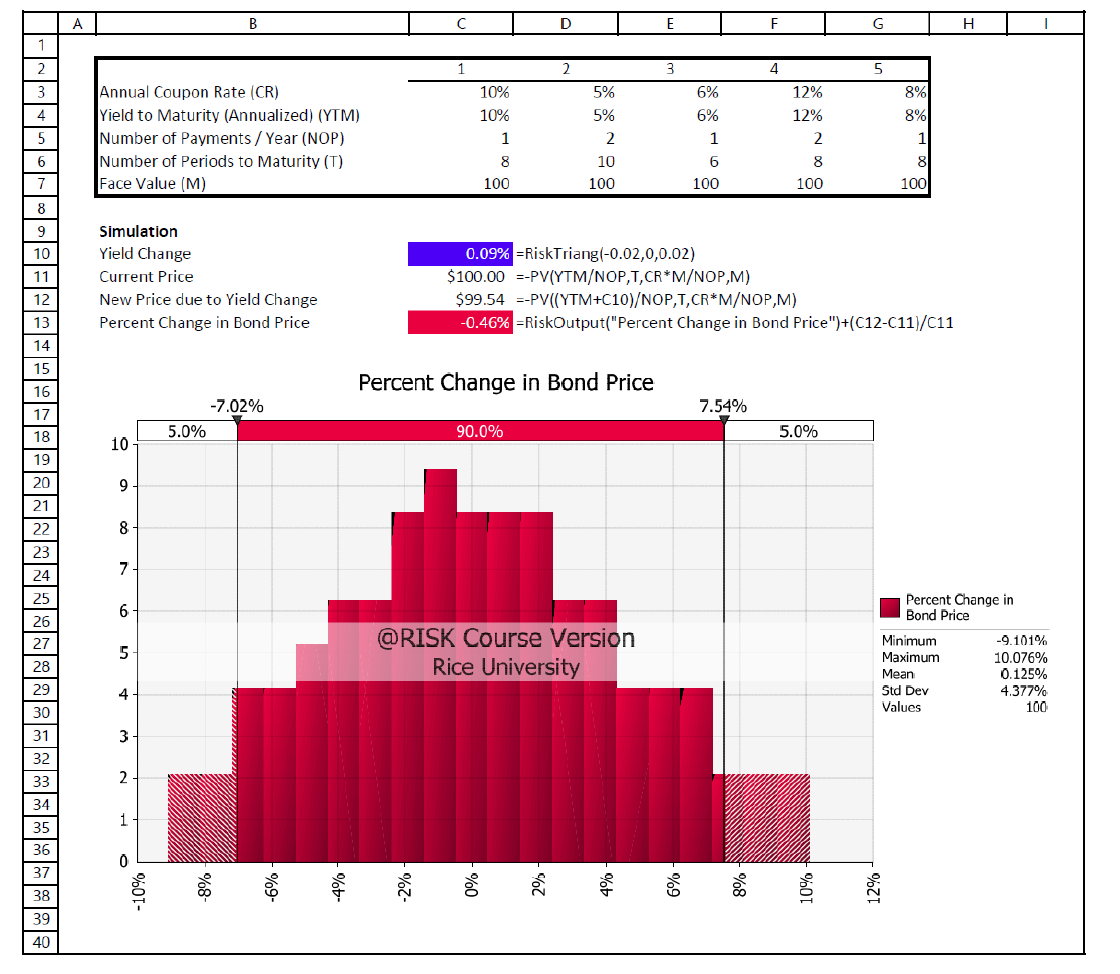
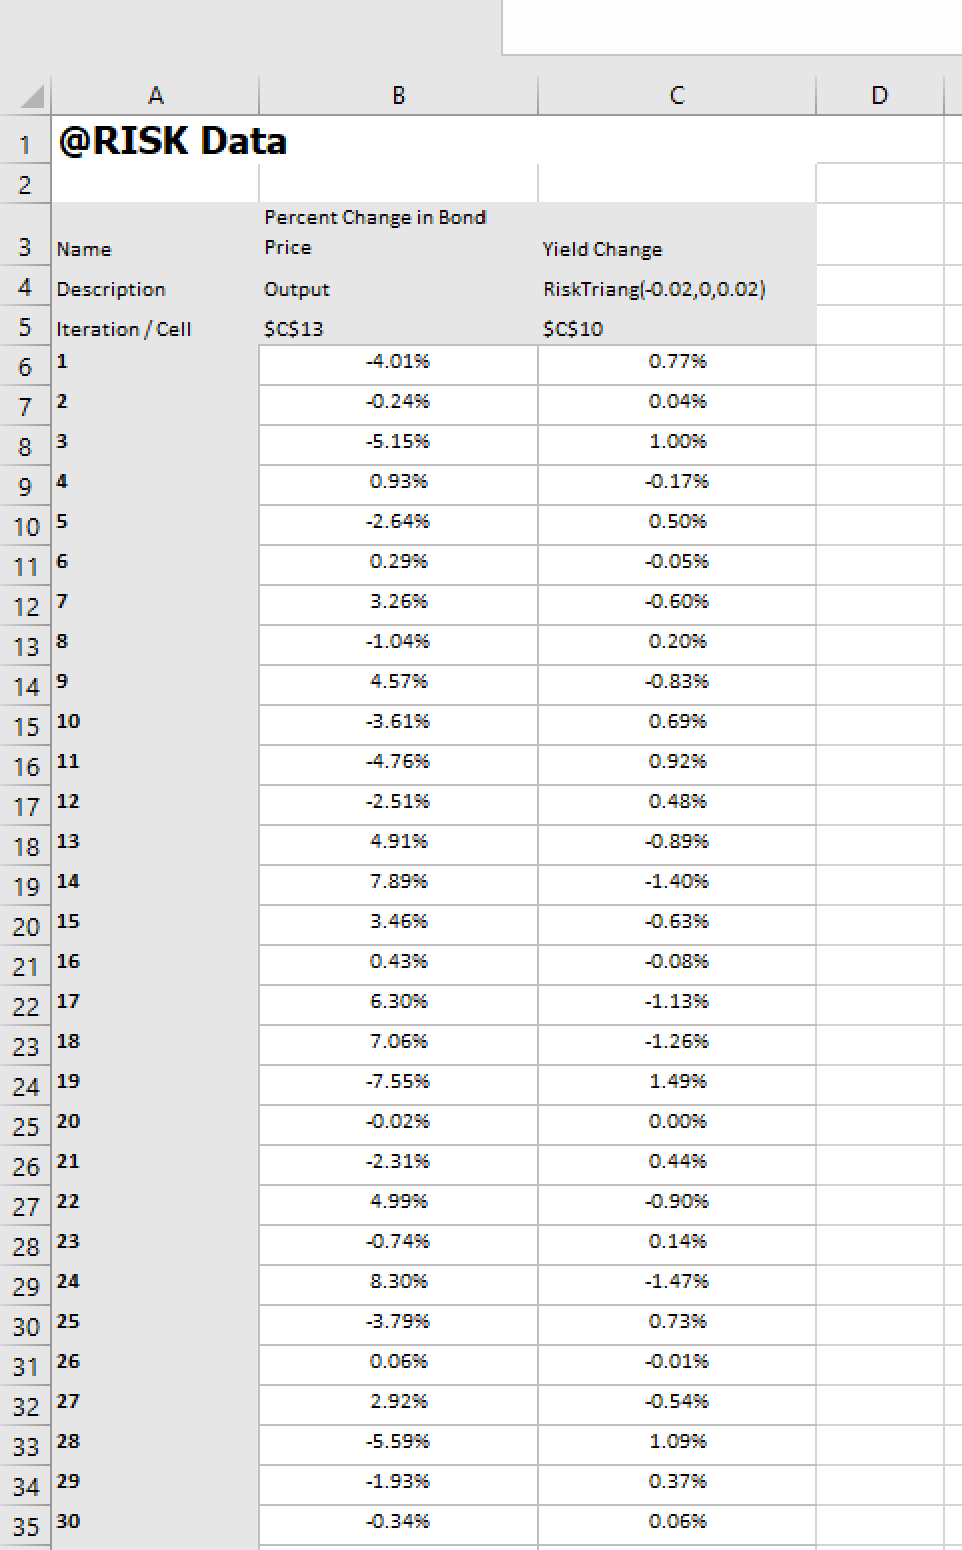
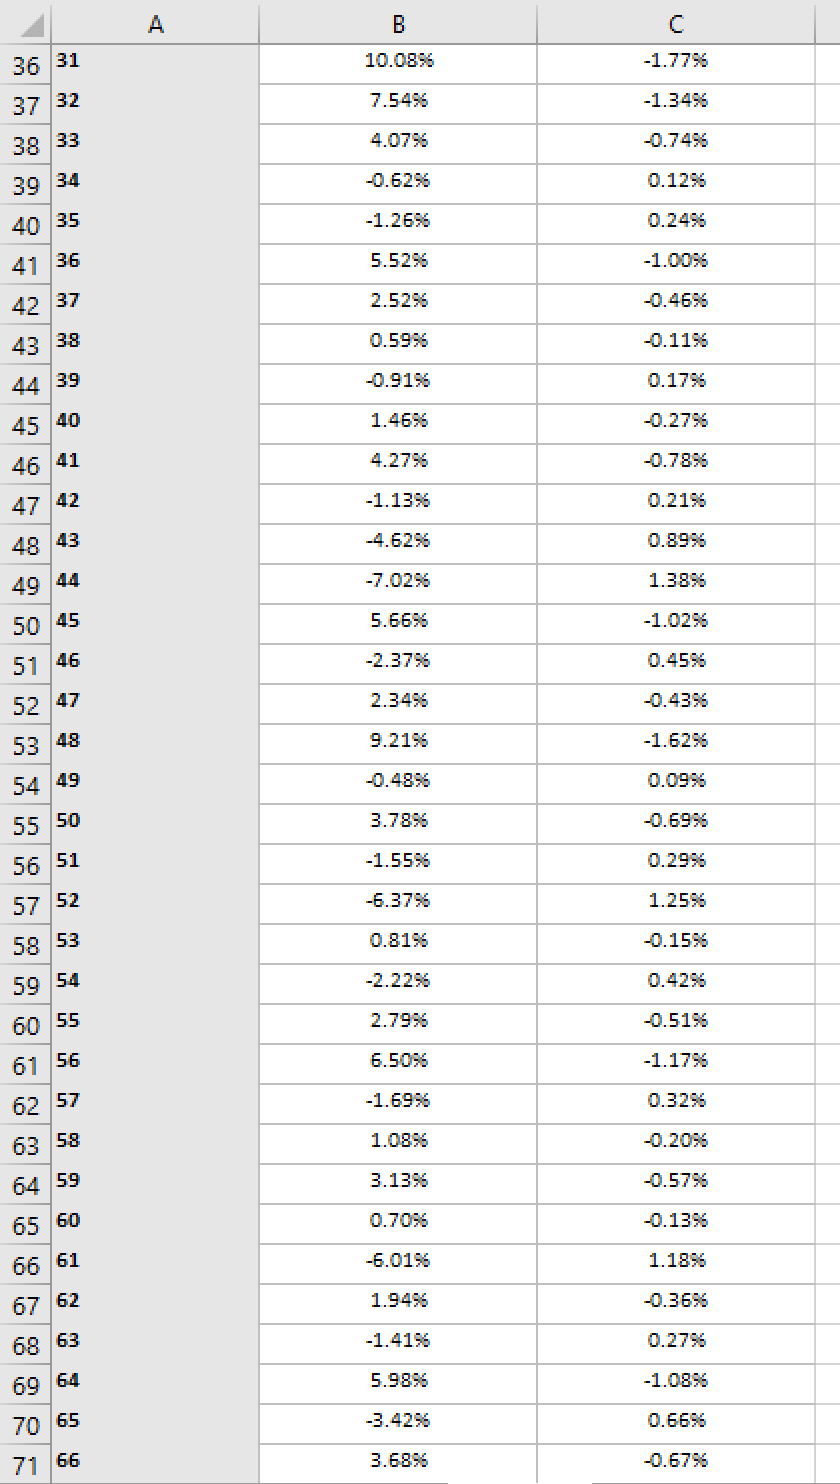
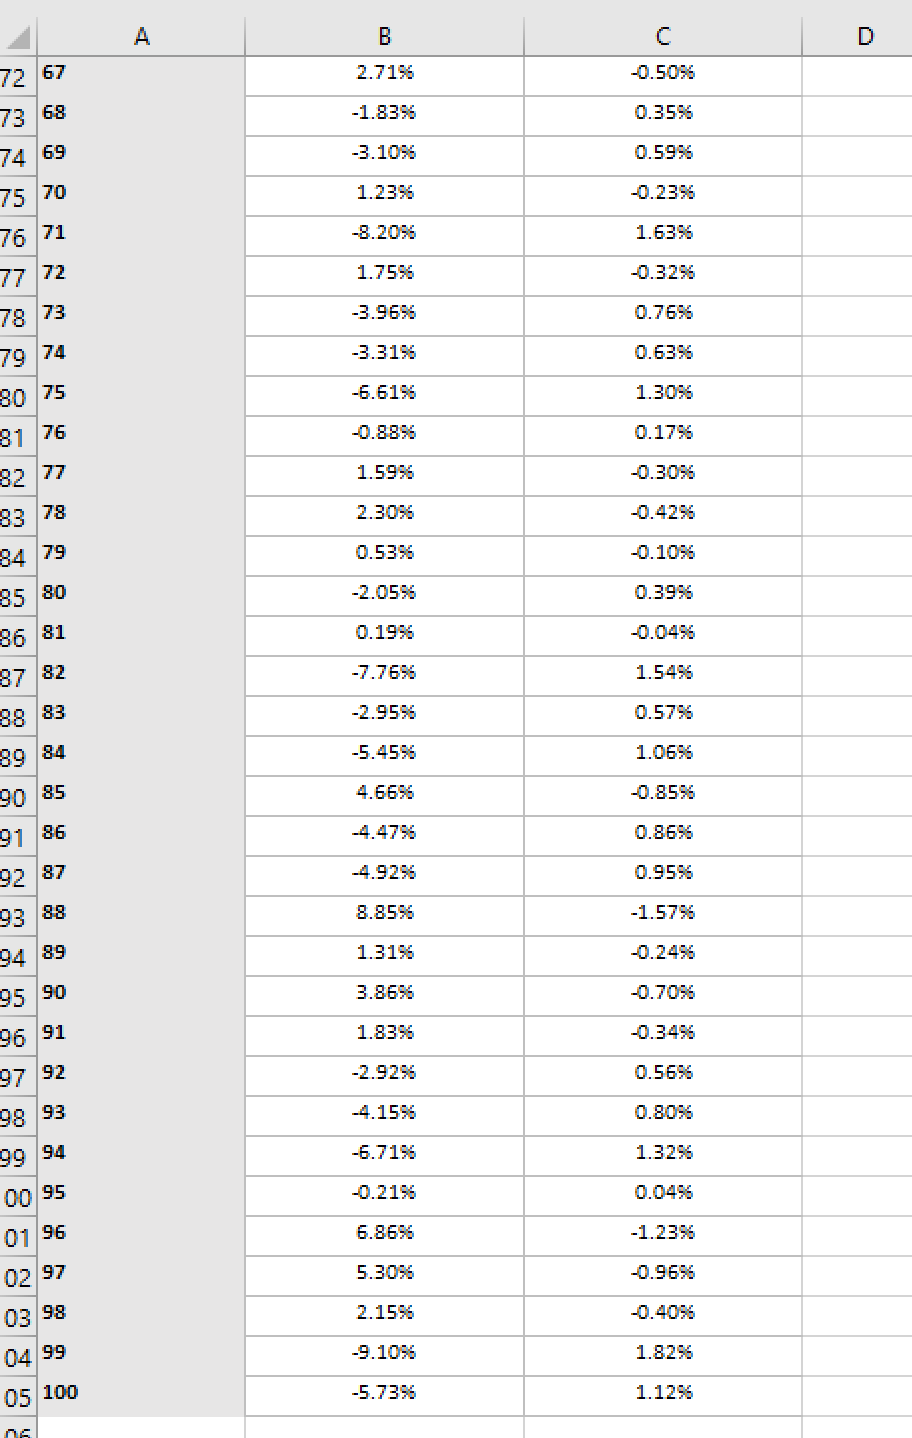
The fund's founder believes that it is most likely that bond yields stay the same, but that it is possible (but very unlikely) that the yields for all of the bonds could drop as much as 200 basis points or rise by as much as 200 basis points. Your colleague has been working on a Monte Carlo analysis of the price risk faced by these potential interest rate moves. Their simulation model and output are on the following page. The simulated data can be found in the Q3 Data tab of the spreadsheet. Unfortunately, they only sent you a screenshot of the model and the data, so you cannot immediately tell which bond they were analyzing (since they named the input cells and all the bonds are currently trading atpar). Provide your answer in excel sheet format. The FORMATTEXT shall be used to display formulas. Populate results for each Parts (parts a, part b and part c) with explanations for each question.
1 | 2 | 3 | 4 | 5 | |
Annual Coupon Rate (CR) | 10% | 5% | 6% | 12% | 8% |
Yield to Maturity (Annualized) (YTM) | 10% | 5% | 6% | 12% | 8% |
Number of Payments / Year (NOP) | 1 | 2 | 1 | 2 | 1 |
Number of Periods to Maturity (T) | 8 | 10 | 6 | 8 | 8 |
Face Value (M) | 100 | 100 | 100 | 100 | 100 |
Please use the simulated data, the simulation output, and the bond concepts discussed in class to answer the following questions.
Part a: If the founder's forecast of the future distribution of interest rates iscorrect, what is the expected gain/loss (in percentage terms) on the bond beinganalyzed?
Part b: Run the following regression using the simulated data and interpret the estimate of the slope coefficient b.
= + +
Part c: Which bond (1, 2, 3, 4 or 5) is it most likely that your colleague is analyzing? Explain your reasoning.
(Hint: You can determine this without setting up a simulation in @Risk. Think about how the regression equation in part (b) relates to the interest rate risk concepts discussed in class for bonds.)
Step by Step Solution
There are 3 Steps involved in it

Get step-by-step solutions from verified subject matter experts