

Question: Q3. Assume that using maximum likelihood estimation you obtain the following results from estimating two different Logit models using data on a large cross-sectional sample
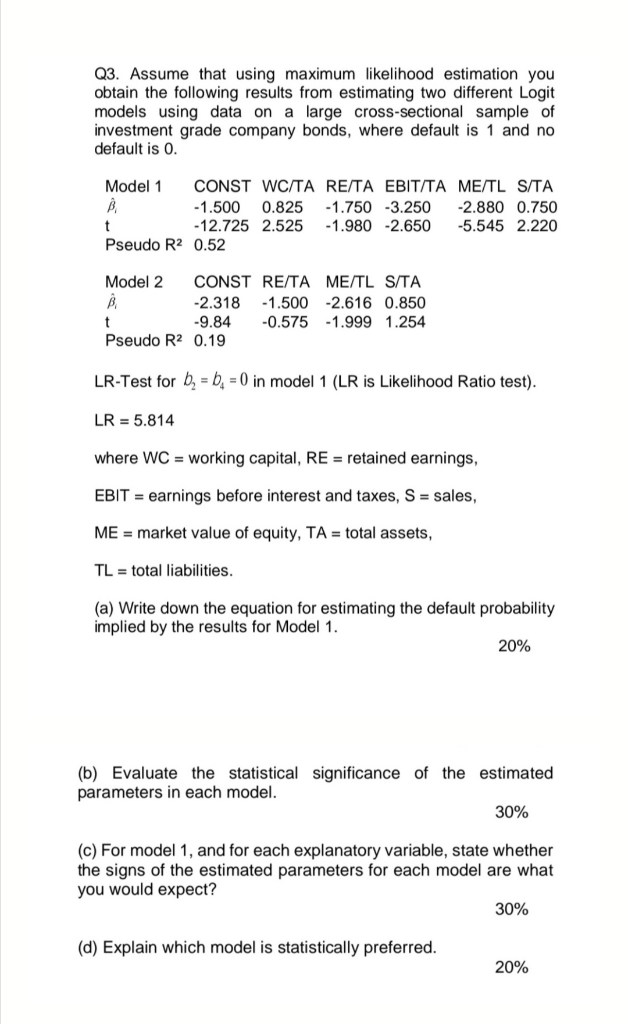
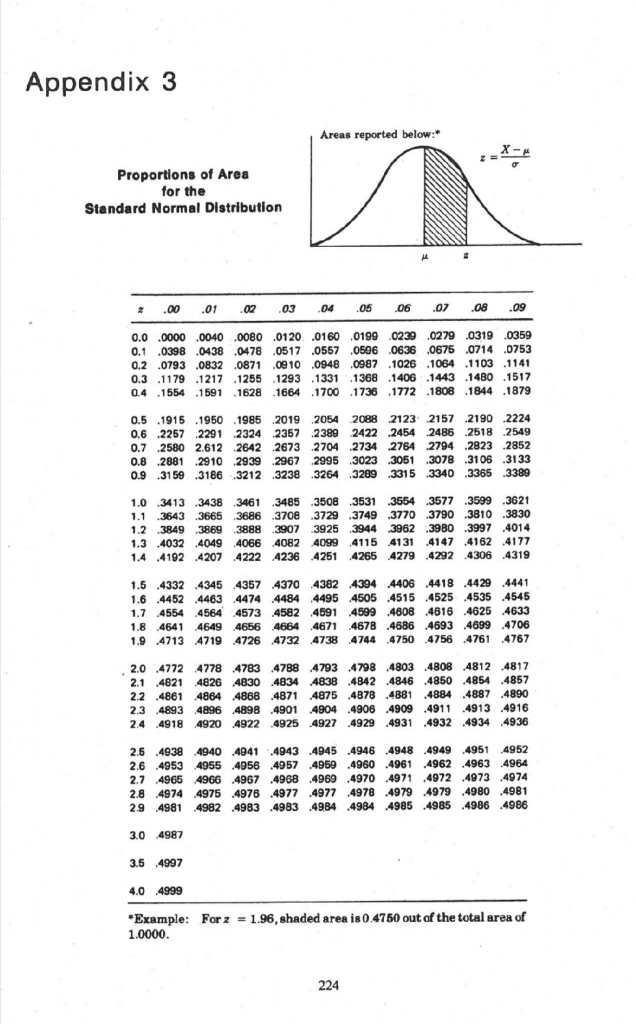
Q3. Assume that using maximum likelihood estimation you obtain the following results from estimating two different Logit models using data on a large cross-sectional sample of investment grade company bonds, where default is 1 and no default is 0. Model 1 CONST WC/TA RE/TA EBIT/TA ME/TL S/TA - 1.500 0.825 -1.750 -3.250 -2.880 0.750 -12.725 2.525 -1.980 -2.650 -5.545 2.220 Pseudo R2 0.52 t Model 2 CONST RE/TA ME/TL S/TA B -2.318 -1.500 -2.616 0.850 -9.84 -0.575 -1.999 1.254 Pseudo R2 0.19 t LR-Test for b = b = 0) in model 1 (LR is Likelihood Ratio test). LR = 5.814 where WC = working capital, RE = retained earnings, EBIT = earnings before interest and taxes, S = sales, ME = market value of equity, TA = total assets, TL = total liabilities. (a) Write down the equation for estimating the default probability implied by the results for Model 1. 20% (b) Evaluate the statistical significance of the estimated parameters in each model. 30% (c) For model 1, and for each explanatory variable, state whether the signs of the estimated parameters for each model are what you would expect? 30% (d) Explain which model is statistically preferred. 20% Appendix 3 Areas reported below: Proportions of Area for the Standard Normal Distribution M 2 2 .00 .01 .02 .03 .04 05 .06 .07 .08 .09 0.0 .0000 .0040 .0080 .0120 .0160 .0199 0239 .0279 .0319 .0359 0.1 .0398 .0438 .0478 0517 .0557 0506 0636 .0675 0714 .0753 0.2 .0793 .0832 .0871.0010.0948 0987 1026 1064 1103 1141 0.3 .1179 .1217 .1255 1293 1331 .1368 1406 1443 1480 1517 0.4.1554 .1591.1628 1664 1700 1736 1772 1808 1844 1879 0.5.1915 1950 1985 2019 2054 2088 2123 2157 2190 .2224 0.6 2257 2291 2324 2357 2389 2422 2454 2486 2518 2549 0.7 2580 2.612 2642 2673 2704 2734 2764 2794 2823 .2852 0.8 2881 2910 2939 2967 .2995 3023 3051 3078 3106 3133 0.9 .3159 .3186 .3212 3238 3264 3289 .3315 3340 3365.3389 1.0 3413 3438 3461 3485 .3508 3531 3554 .3577 .3599 .3599 .3621 .3643 3665 3686 .3686.3708 3729 .3749 3770 3790 3810 3830 1.2 .3849 .3869 3888 3907 3925 .3944 3962 3980 3997.4014 1.3 .4032 4049 4066 4082 4099 4115 4131 4147 .4162 .4177 1.4 .4192.4207 4222 4236 4251 4265 4279.4292.4306 4319 1.5 .4332 4345 4357 4370 43824394 4406 .4418 .4429 4441 1.6 .4452 4463.4474 4484 4495 4505 .4515 .4525 4535 .4545 1.7 .4554 4564 4573 4582 4591 4599 4608 4616 .4625 4633 1.8 .4641 4649 4656 4664.4671 4678 .4686 .4693 .4699 .4706 1.9.4713 4719 4726 4732 4738 4744 4750 4756.4761 4767 2.0 .4772 4778 4783 4788 4793 .4798 4803 .4808 48124817 2.1 .4821 4826 4830 4834 4838 .4842 4846 .4850 4854 4857 2.2.4861 4864 4868 4871 4875 .4878 .4881.4884 .4887 4890 2.3 .4893 4896 4898 .4901 4904 .4906 .4909.4911 .4913 .4916 2.4 4918 4920 4922 4925 4927.4929 .4931 .4932 .4934 ,4936 2.6 .4938.4940 4941 .4943 .4945 .4946 .4948.4949.4951 4952 2.6 .4953 4955 4956 .4957.4959 .4960.4961,4962 .4963 4964 2.7 4965 4966 4967.4968 .4969 .4970.4971.4972 .4973 .4974 2.8 .4974 4975 4978 .4977 4977 4978 ,4979 4979 .4980.4981 2.9.4981 4982 4983 .4983 .4984 .4984 .4985 .4985 .4986 4986 3.0 4987 3.5 4997 4.0 4999 *Example: For 2 = 1.96, shaded area is 0.4750 out of the total area of 1.0000. 224 Q3. Assume that using maximum likelihood estimation you obtain the following results from estimating two different Logit models using data on a large cross-sectional sample of investment grade company bonds, where default is 1 and no default is 0. Model 1 CONST WC/TA RE/TA EBIT/TA ME/TL S/TA - 1.500 0.825 -1.750 -3.250 -2.880 0.750 -12.725 2.525 -1.980 -2.650 -5.545 2.220 Pseudo R2 0.52 t Model 2 CONST RE/TA ME/TL S/TA B -2.318 -1.500 -2.616 0.850 -9.84 -0.575 -1.999 1.254 Pseudo R2 0.19 t LR-Test for b = b = 0) in model 1 (LR is Likelihood Ratio test). LR = 5.814 where WC = working capital, RE = retained earnings, EBIT = earnings before interest and taxes, S = sales, ME = market value of equity, TA = total assets, TL = total liabilities. (a) Write down the equation for estimating the default probability implied by the results for Model 1. 20% (b) Evaluate the statistical significance of the estimated parameters in each model. 30% (c) For model 1, and for each explanatory variable, state whether the signs of the estimated parameters for each model are what you would expect? 30% (d) Explain which model is statistically preferred. 20% Appendix 3 Areas reported below: Proportions of Area for the Standard Normal Distribution M 2 2 .00 .01 .02 .03 .04 05 .06 .07 .08 .09 0.0 .0000 .0040 .0080 .0120 .0160 .0199 0239 .0279 .0319 .0359 0.1 .0398 .0438 .0478 0517 .0557 0506 0636 .0675 0714 .0753 0.2 .0793 .0832 .0871.0010.0948 0987 1026 1064 1103 1141 0.3 .1179 .1217 .1255 1293 1331 .1368 1406 1443 1480 1517 0.4.1554 .1591.1628 1664 1700 1736 1772 1808 1844 1879 0.5.1915 1950 1985 2019 2054 2088 2123 2157 2190 .2224 0.6 2257 2291 2324 2357 2389 2422 2454 2486 2518 2549 0.7 2580 2.612 2642 2673 2704 2734 2764 2794 2823 .2852 0.8 2881 2910 2939 2967 .2995 3023 3051 3078 3106 3133 0.9 .3159 .3186 .3212 3238 3264 3289 .3315 3340 3365.3389 1.0 3413 3438 3461 3485 .3508 3531 3554 .3577 .3599 .3599 .3621 .3643 3665 3686 .3686.3708 3729 .3749 3770 3790 3810 3830 1.2 .3849 .3869 3888 3907 3925 .3944 3962 3980 3997.4014 1.3 .4032 4049 4066 4082 4099 4115 4131 4147 .4162 .4177 1.4 .4192.4207 4222 4236 4251 4265 4279.4292.4306 4319 1.5 .4332 4345 4357 4370 43824394 4406 .4418 .4429 4441 1.6 .4452 4463.4474 4484 4495 4505 .4515 .4525 4535 .4545 1.7 .4554 4564 4573 4582 4591 4599 4608 4616 .4625 4633 1.8 .4641 4649 4656 4664.4671 4678 .4686 .4693 .4699 .4706 1.9.4713 4719 4726 4732 4738 4744 4750 4756.4761 4767 2.0 .4772 4778 4783 4788 4793 .4798 4803 .4808 48124817 2.1 .4821 4826 4830 4834 4838 .4842 4846 .4850 4854 4857 2.2.4861 4864 4868 4871 4875 .4878 .4881.4884 .4887 4890 2.3 .4893 4896 4898 .4901 4904 .4906 .4909.4911 .4913 .4916 2.4 4918 4920 4922 4925 4927.4929 .4931 .4932 .4934 ,4936 2.6 .4938.4940 4941 .4943 .4945 .4946 .4948.4949.4951 4952 2.6 .4953 4955 4956 .4957.4959 .4960.4961,4962 .4963 4964 2.7 4965 4966 4967.4968 .4969 .4970.4971.4972 .4973 .4974 2.8 .4974 4975 4978 .4977 4977 4978 ,4979 4979 .4980.4981 2.9.4981 4982 4983 .4983 .4984 .4984 .4985 .4985 .4986 4986 3.0 4987 3.5 4997 4.0 4999 *Example: For 2 = 1.96, shaded area is 0.4750 out of the total area of 1.0000. 224
Step by Step Solution
There are 3 Steps involved in it

Get step-by-step solutions from verified subject matter experts