

Question: Q3. Based on following project updates calculate Schedule Variance, Cost Variance, Schedule Performance Index (SPI), Cost Performance Index (CPI). Estimate the revised cost at completion.
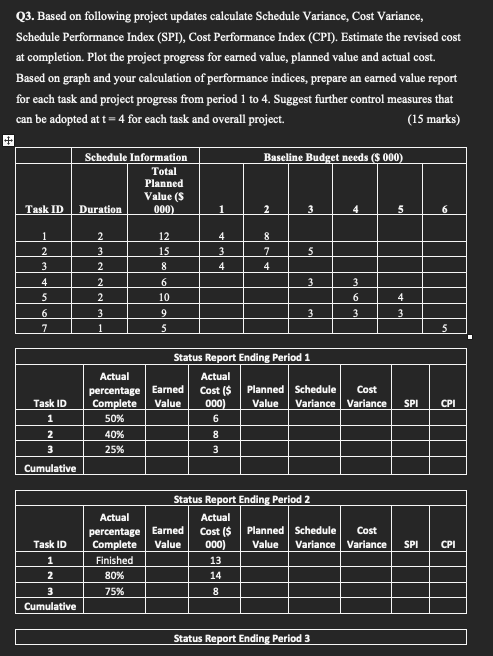
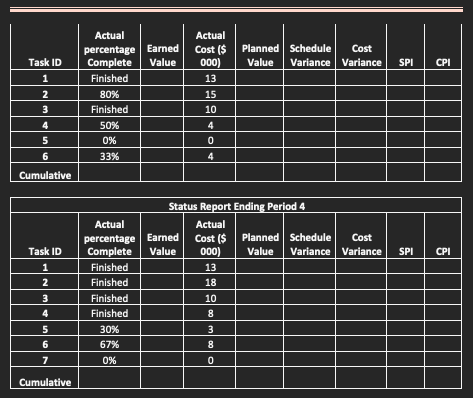
Q3. Based on following project updates calculate Schedule Variance, Cost Variance, Schedule Performance Index (SPI), Cost Performance Index (CPI). Estimate the revised cost at completion. Plot the project progress for earned value, planned value and actual cost. Based on graph and your calculation of performance indices, prepare an earned value report for each task and project progress from period 1 to 4. Suggest further control measures that can be adopted at t= 4 for each task and overall project. (15 marks) Schedule Information Baseline Budget needs ($ 000) Total Planned Value (S 000) Task ID Duration 1 2 3 4 5 6 4 3 8 7 4 5 1 2 3 4 5 6 7 12 15 8 6 10 4 2 3 2 2 2 3 1 3 3 6 4 9 3 3 3 5 5 Status Report Ending Period 1 Actual Actual percentage Earned Cost ($ Planned Schedule Cost Complete Value 000) Value Variance Variance 50% 6 40% 8 25% 3 SPI Task ID 1 2 3 CPI Cumulative Status Report Ending Period 2 Actual Actual percentage Earned Cost ($ Planned Schedule Cost Complete Value 000) Value Variance Variance Finished 13 80% 14 75% 8 SPI Task ID 1 2 3 Cumulative CPI Status Report Ending Period 3 SPI CPI Task ID 1 2 Actual percentage Earned Complete Value Finished 80% Finished 50% 0% 33% Actual Cost ($ Planned Schedule Cost 000) Value Variance Variance 13 15 10 4 0 4 3 4 5 5 6 Cumulative SPI CPI Task ID 1 2 Status Report Ending Period 4 Actual Actual percentage Earned Cost ($ Planned Planned Schedule Cost Complete Value 000) Value Variance Variance Finished 13 Finished 18 Finished 10 Finished 30% 3 67% 8 0% 0 3 00 4 5 6 7 Cumulative Q3. Based on following project updates calculate Schedule Variance, Cost Variance, Schedule Performance Index (SPI), Cost Performance Index (CPI). Estimate the revised cost at completion. Plot the project progress for earned value, planned value and actual cost. Based on graph and your calculation of performance indices, prepare an earned value report for each task and project progress from period 1 to 4. Suggest further control measures that can be adopted at t= 4 for each task and overall project. (15 marks) Schedule Information Baseline Budget needs ($ 000) Total Planned Value (S 000) Task ID Duration 1 2 3 4 5 6 4 3 8 7 4 5 1 2 3 4 5 6 7 12 15 8 6 10 4 2 3 2 2 2 3 1 3 3 6 4 9 3 3 3 5 5 Status Report Ending Period 1 Actual Actual percentage Earned Cost ($ Planned Schedule Cost Complete Value 000) Value Variance Variance 50% 6 40% 8 25% 3 SPI Task ID 1 2 3 CPI Cumulative Status Report Ending Period 2 Actual Actual percentage Earned Cost ($ Planned Schedule Cost Complete Value 000) Value Variance Variance Finished 13 80% 14 75% 8 SPI Task ID 1 2 3 Cumulative CPI Status Report Ending Period 3 SPI CPI Task ID 1 2 Actual percentage Earned Complete Value Finished 80% Finished 50% 0% 33% Actual Cost ($ Planned Schedule Cost 000) Value Variance Variance 13 15 10 4 0 4 3 4 5 5 6 Cumulative SPI CPI Task ID 1 2 Status Report Ending Period 4 Actual Actual percentage Earned Cost ($ Planned Planned Schedule Cost Complete Value 000) Value Variance Variance Finished 13 Finished 18 Finished 10 Finished 30% 3 67% 8 0% 0 3 00 4 5 6 7 Cumulative
Step by Step Solution
There are 3 Steps involved in it

Get step-by-step solutions from verified subject matter experts