Question: The following data have been collected for the project based on weekly reporting periods. Fill in the tables by calculating EV, PV, CV, and SV
The following data have been collected for the project based on weekly reporting periods. Fill in the tables by calculating EV, PV, CV, and SV for week 1 through week 8.
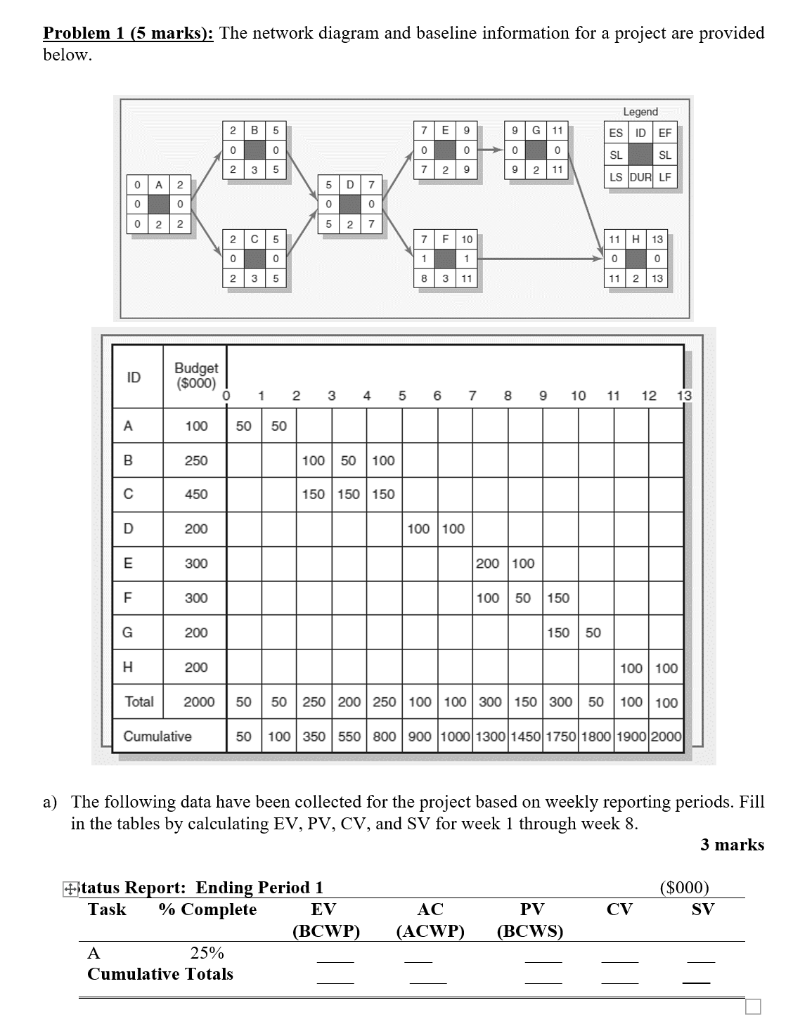
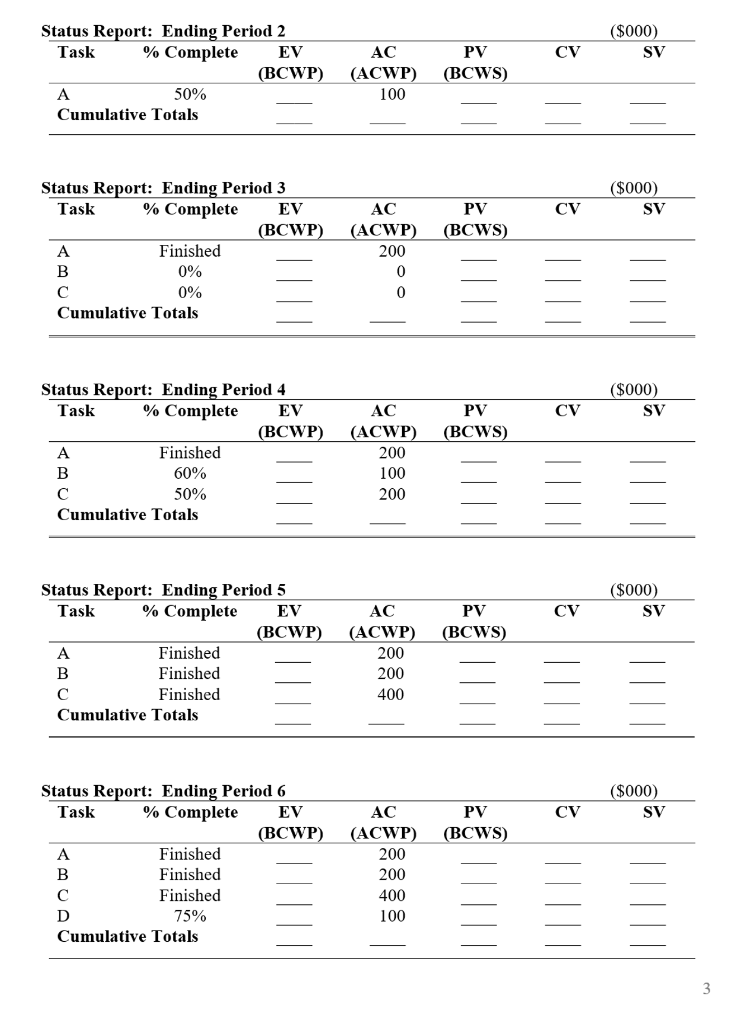
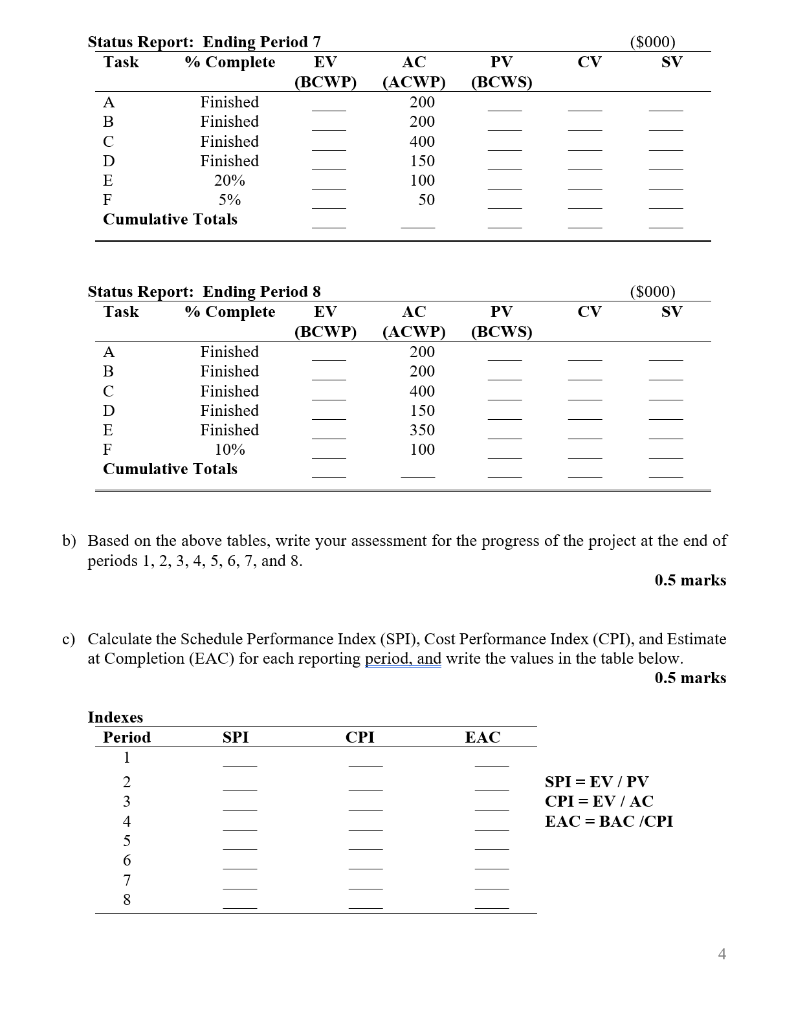

Problem 1 (5 marks): The network diagram and baseline information for a project are provided below. Legend ES ID EF 2 B 5 0 0 7 E 9 9 G11 0 00 0 0 7 7 2 9 2 9 9 211 SL SL 2 235 LS DUR LE 0 A 2 o||2 0 0 0 0 2 2 507 0 0 5 5 27 2 C 5 0 7 F 10 1 1 8 3 11 11 H13 H 0 0 BOB 2 235 11 2 13 ID Budget ($000) 0 13 1 2 3 4 5 6 7 8 9 10 11 12 50 50 100 B 250 100 50 100 450 150 150 150 D 200 100 100 E 300 200 100 F 300 100 50 150 G 200 | 150 | 50 H 200 100 100 Total 2000 50 50 250 200 250 100 100 300 150 300 50 100 100 Cumulative 50 100 350 550 800 900 1000 1300 1450 1750 1800 1900 2000 a) The following data have been collected for the project based on weekly reporting periods. Fill in the tables by calculating EV, PV, CV, and SV for week 1 through week 8. 3 marks ($000) SV CV *tatus Report: Ending Period 1 Task % Complete EV (BCWP) A 25% Cumulative Totals AC (ACWP) PV (BCWS) ($000) SV CV Status Report: Ending Period 2 Task % Complete EV (BCWP) A 50% Cumulative Totals AC (ACWP) 100 PV (BCWS) ($000) SV CV PV (BCWS) Status Report: Ending Period 3 Task % Complete EV (BCWP) A Finished B 0% 0% Cumulative Totals AC (ACWP) 200 0 0 ($000) SV CV PV (BCWS) Status Report: Ending Period 4 Task % Complete EV (BCWP) A Finished B 60% 50% Cumulative Totals AC (ACWP) 200 100 200 ($000) SV CV AC (ACWP) PV (BCWS) Status Report: Ending Period 5 Task % Complete EV (BCWP) A Finished B Finished Finished Cumulative Totals 200 200 400 ($000) SV CV AC (ACWP) 200 PV (BCWS) Status Report: Ending Period 6 Task % Complete EV (BCWP) A Finished Finished Finished D 75% Cumulative Totals 400 100 3 ($000) SV CV PV (BCWS) Status Report: Ending Period 7 Task % Complete EV (BCWP) A Finished B Finished Finished D Finished E 20% F 5% Cumulative Totals AC (ACWP) 200 200 400 150 100 50 ($000) SV CV PV (BCWS) Status Report: Ending Period 8 Task % Complete EV (BCWP) A Finished B. Finished C Finished D Finished E Finished F 10% Cumulative Totals AC (ACWP) 200 200 400 150 350 100 b) Based on the above tables, write your assessment for the progress of the project at the end of periods 1, 2, 3, 4, 5, 6, 7, and 8. 0.5 marks c) Calculate the Schedule Performance Index (SPI), Cost Performance Index (CPI), and Estimate at Completion (EAC) for each reporting period, and write the values in the table below. 0.5 marks Indexes Period 1 SPI CPI EAC 2 3 SPI = EV / PV CPI = EVAC EAC = BAC/CPI 4 5 6 7 8 4 d) Using the above data, plot the curves for PV, EV, and AC on a graph. (You can either: (i) manually sketch the graph on a piece of paper, take a photo with your cell phone, and insert the picture in the report, or (ii) electronically create the graph using Excel or another software.) 0.5 marks e) Discuss the project prospects based on the graph and based on the calculated values for the performance indices. 0.5 marks


