

Question: Q3. Select, perform, and interpret a t test with SPSS (11 points total) The researcher would like to examine the potential relationship between education and
Q3. Select, perform, and interpret a t test with SPSS (11 points total)
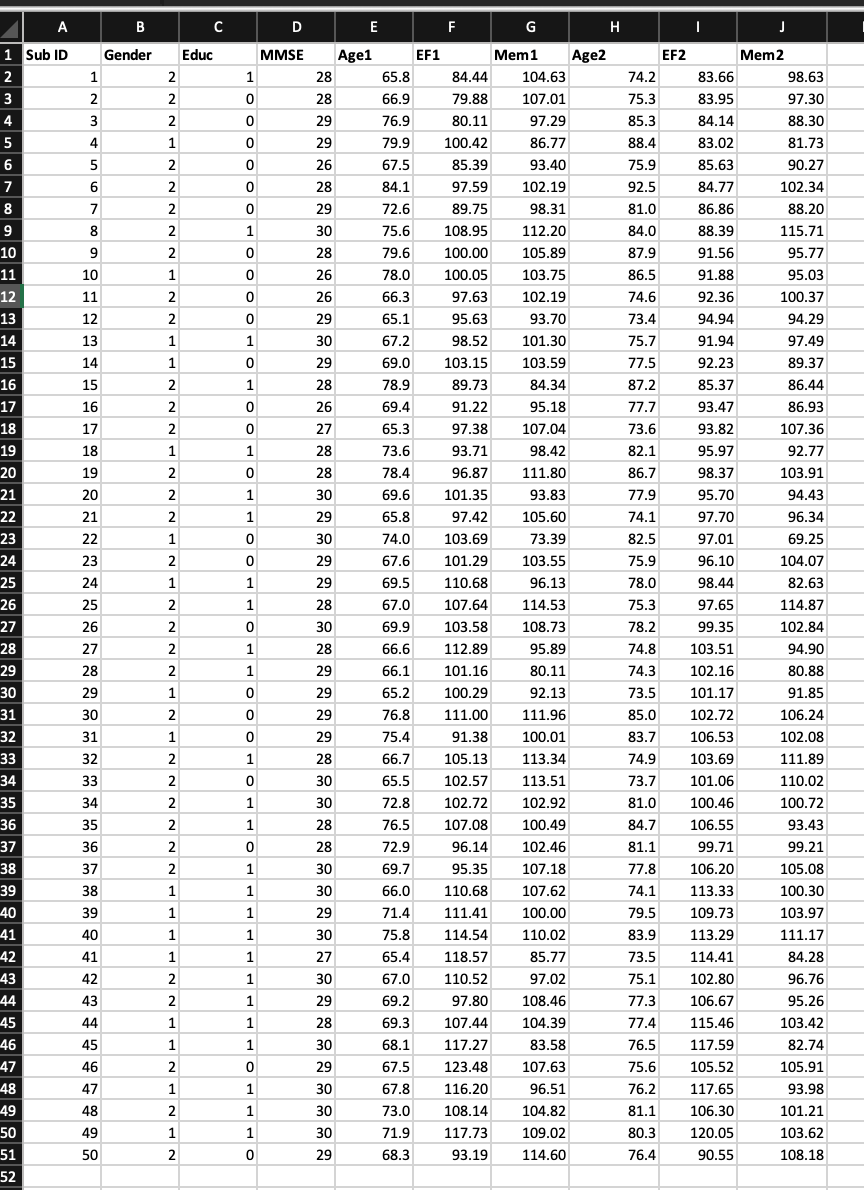
The researcher would like to examine the potential relationship between education and executive function assessed during the first testing session (EF1). In this data set, education is indicated by either having no college degree or having a college degree or above. Perform a two-tailed t test with ? = .05 to answer the following question:
Is there a significant difference in executive function between people without a college degree and those with a college degree or above?
A. What type of t test should be performed to answer this question? What is your rationale?
(2 points total: 1 for each question)
B. Create (alternative hypothesis and null hypothesis) from the research question. Type the hypotheses out both in words and in symbol notations.
Hint: The hypotheses should be non-directional for the two-tailed test.
(2 points total: 1 for each hypothesis. If symbol notation or written format is missing or incorrect for a hypothesis, deduct .5)
C. Run the analysis in SPSS and answer the following questions based on the analysis results.
1. Paste all the output tables from SPSS for this test. No point will be earned for the rest of the questions in Q3 if the output tables are not pasted or are incomplete.
2. Use the SPSS output to calculate effect size, Cohen's d. Must show the calculation process.
(2 points: deduct 1 if the process is correct but the calculation has errors.)
3. Report the t test result in symbols according to the APA standards, including t statistic with degree of freedom, p value, and effect size d.
-Present all the items in one single line, separated by commas, with the symbols italicized.
-Report "p
(2 points: deduct .5 for each error in value or format up to 3 total)
4. What is your decision about the null hypothesis (reject or fail to reject)? What is your rationale? (2 points total: 1 for each answer)
5. What is the answer to the research question? What was the direction of the difference between these two groups? (1 point: .5 for each question)
\f
Step by Step Solution
There are 3 Steps involved in it

Get step-by-step solutions from verified subject matter experts