

Question: Q3 The table to the left shows monthly return data for the last 20 years. In addition to the date, It includes... Fund's Excess Returns
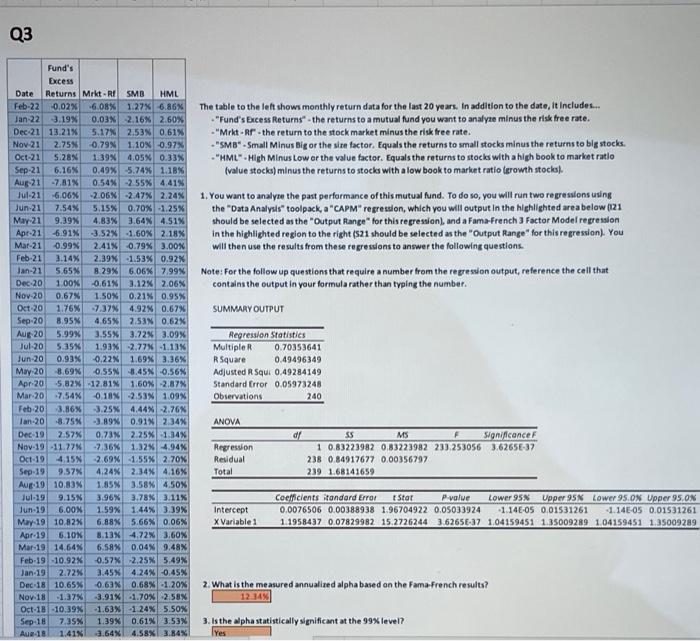
Q3 The table to the left shows monthly return data for the last 20 years. In addition to the date, It includes... "Fund's Excess Returns the returns to a mutual fund you want to analyze minus the risk free rate. -"Mrkt - Rr-the return to the stock market minus the risk free rate. - "SMB"-Small Minus Big or the strefactor. Equals the returns to small stocks minus the returns to big stocks. "HML.High Minus Low or the value factor. Equals the returns to stocks with a high book to market ratio (value stocks) minus the returns to stocks with a low book to market ratio (growth stocks). 1. You want to analyze the past performance of this mutual fund. To do so, you will run two repressions using the "Data Analysis" toolpack a 'CAPM" regression, which you will output in the highlighted area below (121 should be selected as the "Output Range for this regression, and a Fama-French 3 Factor Model regression in the highlighted region to the right (521 should be selected as the "Output Range" for this regression). You will then use the results from these repressions to answer the following questions Note: For the follow up questions that require a number from the repression output, reference the cell that contains the output in your formula rather than typing the number SUMMARY OUTPUT Fund's Excess Date Returns Mrkt - RI SMB HML Feb-22 -0.02% 6.08% 1.27% 6.86% Jan 22 3.19% 0.03% 2.16% 2.60% Dec 21 13.21% 5.17% 2.53 0.61% Nov 21 2.75 0.79N 1.10% -0.97% Oct-21 5.28% 1.39% 4.05% 0.33% Sep-21 6.16% 0.49% -5.74% 1.18% Aug 21 -7,81% 0.54% -2.55% 4,41% Jul-21 -6.06% -2.06% -2.47% 2.24% Jun-21 7.54% 5.15% 0.70% 1.25% May 21 9.39% 4.83 3.64% 4.51% Apt 21 -6.91% -3.52% -1.602.18% Mar-21 0.99% 2.41% 0.79% 3.00% Feb-21 3.14% 2.39% -1.53% 0.92% Jan-21 5.65% 8.29% 6.06% 7.99% Dec 20 1.00% 0.61% 3.12% 2.06% Nov 20 0.67% 1.50% 0.21% 0.95% Oct 20 1.76% 7.37 4.92 0.67% Sep 20 8.95% 4.65% 2.53 0.62% Aug 20 5.99% 3.55% 3.72% 3.09% Jul-20 5.35% 1.93% -2.77-1.13% Jun-20 0.93% -0.22% 1.69% 3.36% May-20 8.69 0.55 -3.45% -0.56N Apr-20 -5.82% -12,81% 1.60% -2.87% Mar 20 -7.54% 0.18% -2.53% 1.09% Feb-203.86% 3.25% 4.4422.76 Jan-20 -8.75% -3.89% 0.91% 2.34% Dec 19 2.57% 0.73% 2.25% -1.34% Nov-19 -11.77% -2.36% 1.32% -4.94% Oct19 4.15N 2.69% -1.55% 2.70% Sep-19 9.57% 4.24% 2.34% 4.16% Aug 19 10.83% 1.85% 3.58% 4.50% Jul 19 9.15 3.96% 3.78% 3.11% Jun-19 6.00N 1.59% 1.44% 3.39% May 19 10.82% 6.88N 5.66% 0.06% Apr-19 6.10 3.13% 4.72% 3.60% Mar-19 14.64% 6.58% 0.04% 9,48% Feb-19 10.92% 0.57% -2,25% 5.49% Jan. 19 2.72% 3.45% 4.24% 0.45% Dec 18 10.65% 0.63% 0.68% -1.20% Nov.18 -1.37% 3.91% -1.70% 2.58% Oct-18 -10.39% -1.63% -124% 5.50% Sep-18 7.35% 1.39% 0.61% 3.53% Aue 18 1.41 a.64% 4.58% 3.84% Regression Statistics Multiple 0.70353641 R Square 0.49496349 Adjusted RSqui 0.49284149 Standard Error 0.05973248 Observations 240 ANOVA df Regression Residual Total SS MS Significance 1 0.83223982 0.83223982 233,253056 3.6265E-37 238 0.84917677 0.00356797 239 1.68141659 Intercept X Variables Coefficients itandard Error Star P-value Lower 95N Upper 95% Lower 95.08 Upper 95.0% 0.0076506 0.00388938 1.96704922 0.05033924 -1.14E-05 0.01531261 -1.14E05 0.01531261 1.1958437 0.07829982 15.2726244 3.6265E-37 1.04159451 1.35009289 1.04159451 1.35009289 2. What is the measured annualized alpha based on the Fama French results? 12:34% 3. Is the alpha statistically significant at the 99% level? Yes Q3 The table to the left shows monthly return data for the last 20 years. In addition to the date, It includes... "Fund's Excess Returns the returns to a mutual fund you want to analyze minus the risk free rate. -"Mrkt - Rr-the return to the stock market minus the risk free rate. - "SMB"-Small Minus Big or the strefactor. Equals the returns to small stocks minus the returns to big stocks. "HML.High Minus Low or the value factor. Equals the returns to stocks with a high book to market ratio (value stocks) minus the returns to stocks with a low book to market ratio (growth stocks). 1. You want to analyze the past performance of this mutual fund. To do so, you will run two repressions using the "Data Analysis" toolpack a 'CAPM" regression, which you will output in the highlighted area below (121 should be selected as the "Output Range for this regression, and a Fama-French 3 Factor Model regression in the highlighted region to the right (521 should be selected as the "Output Range" for this regression). You will then use the results from these repressions to answer the following questions Note: For the follow up questions that require a number from the repression output, reference the cell that contains the output in your formula rather than typing the number SUMMARY OUTPUT Fund's Excess Date Returns Mrkt - RI SMB HML Feb-22 -0.02% 6.08% 1.27% 6.86% Jan 22 3.19% 0.03% 2.16% 2.60% Dec 21 13.21% 5.17% 2.53 0.61% Nov 21 2.75 0.79N 1.10% -0.97% Oct-21 5.28% 1.39% 4.05% 0.33% Sep-21 6.16% 0.49% -5.74% 1.18% Aug 21 -7,81% 0.54% -2.55% 4,41% Jul-21 -6.06% -2.06% -2.47% 2.24% Jun-21 7.54% 5.15% 0.70% 1.25% May 21 9.39% 4.83 3.64% 4.51% Apt 21 -6.91% -3.52% -1.602.18% Mar-21 0.99% 2.41% 0.79% 3.00% Feb-21 3.14% 2.39% -1.53% 0.92% Jan-21 5.65% 8.29% 6.06% 7.99% Dec 20 1.00% 0.61% 3.12% 2.06% Nov 20 0.67% 1.50% 0.21% 0.95% Oct 20 1.76% 7.37 4.92 0.67% Sep 20 8.95% 4.65% 2.53 0.62% Aug 20 5.99% 3.55% 3.72% 3.09% Jul-20 5.35% 1.93% -2.77-1.13% Jun-20 0.93% -0.22% 1.69% 3.36% May-20 8.69 0.55 -3.45% -0.56N Apr-20 -5.82% -12,81% 1.60% -2.87% Mar 20 -7.54% 0.18% -2.53% 1.09% Feb-203.86% 3.25% 4.4422.76 Jan-20 -8.75% -3.89% 0.91% 2.34% Dec 19 2.57% 0.73% 2.25% -1.34% Nov-19 -11.77% -2.36% 1.32% -4.94% Oct19 4.15N 2.69% -1.55% 2.70% Sep-19 9.57% 4.24% 2.34% 4.16% Aug 19 10.83% 1.85% 3.58% 4.50% Jul 19 9.15 3.96% 3.78% 3.11% Jun-19 6.00N 1.59% 1.44% 3.39% May 19 10.82% 6.88N 5.66% 0.06% Apr-19 6.10 3.13% 4.72% 3.60% Mar-19 14.64% 6.58% 0.04% 9,48% Feb-19 10.92% 0.57% -2,25% 5.49% Jan. 19 2.72% 3.45% 4.24% 0.45% Dec 18 10.65% 0.63% 0.68% -1.20% Nov.18 -1.37% 3.91% -1.70% 2.58% Oct-18 -10.39% -1.63% -124% 5.50% Sep-18 7.35% 1.39% 0.61% 3.53% Aue 18 1.41 a.64% 4.58% 3.84% Regression Statistics Multiple 0.70353641 R Square 0.49496349 Adjusted RSqui 0.49284149 Standard Error 0.05973248 Observations 240 ANOVA df Regression Residual Total SS MS Significance 1 0.83223982 0.83223982 233,253056 3.6265E-37 238 0.84917677 0.00356797 239 1.68141659 Intercept X Variables Coefficients itandard Error Star P-value Lower 95N Upper 95% Lower 95.08 Upper 95.0% 0.0076506 0.00388938 1.96704922 0.05033924 -1.14E-05 0.01531261 -1.14E05 0.01531261 1.1958437 0.07829982 15.2726244 3.6265E-37 1.04159451 1.35009289 1.04159451 1.35009289 2. What is the measured annualized alpha based on the Fama French results? 12:34% 3. Is the alpha statistically significant at the 99% level? Yes
Step by Step Solution
There are 3 Steps involved in it

Get step-by-step solutions from verified subject matter experts