

Question: The table to the left shows monthly return data for the last 20 years. In addition to the date, it includes... - Fund's Excess Returns
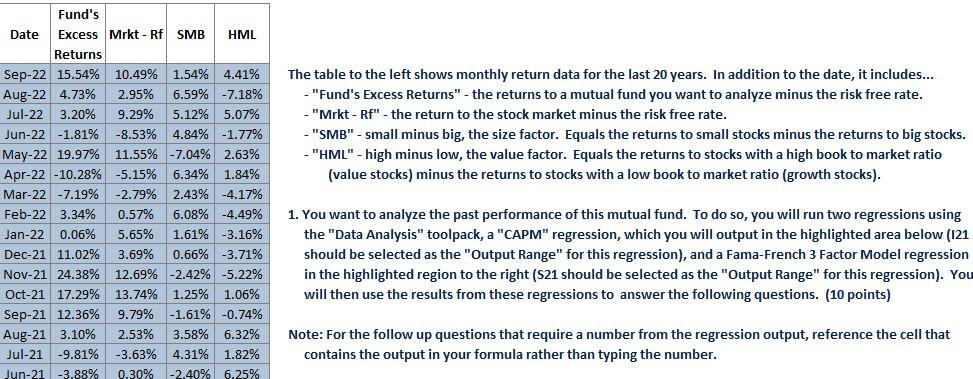
The table to the left shows monthly return data for the last 20 years. In addition to the date, it includes... - "Fund's Excess Returns" - the returns to a mutual fund you want to analyze minus the risk free rate. - "Mrkt - Rf " - the return to the stock market minus the risk free rate. - "SMB" - small minus big, the size factor. Equals the returns to small stocks minus the returns to big stocks. - "HML" - high minus low, the value factor. Equals the returns to stocks with a high book to market ratio (value stocks) minus the returns to stocks with a low book to market ratio (growth stocks). 1. You want to analyze the past performance of this mutual fund. To do so, you will run two regressions using the "Data Analysis" toolpack, a "CAPM" regression, which you will output in the highlighted area below (I21 should be selected as the "Output Range" for this regression), and a Fama-French 3 Factor Model regression in the highlighted region to the right ( S21 should be selected as the "Output Range" for this regression). You will then use the results from these regressions to answer the following questions. (10 points) Note: For the follow up questions that require a number from the regression output, reference the cell that contains the output in your formula rather than typing the number. The table to the left shows monthly return data for the last 20 years. In addition to the date, it includes... - "Fund's Excess Returns" - the returns to a mutual fund you want to analyze minus the risk free rate. - "Mrkt - Rf " - the return to the stock market minus the risk free rate. - "SMB" - small minus big, the size factor. Equals the returns to small stocks minus the returns to big stocks. - "HML" - high minus low, the value factor. Equals the returns to stocks with a high book to market ratio (value stocks) minus the returns to stocks with a low book to market ratio (growth stocks). 1. You want to analyze the past performance of this mutual fund. To do so, you will run two regressions using the "Data Analysis" toolpack, a "CAPM" regression, which you will output in the highlighted area below (I21 should be selected as the "Output Range" for this regression), and a Fama-French 3 Factor Model regression in the highlighted region to the right ( S21 should be selected as the "Output Range" for this regression). You will then use the results from these regressions to answer the following questions. (10 points) Note: For the follow up questions that require a number from the regression output, reference the cell that contains the output in your formula rather than typing the number
Step by Step Solution
There are 3 Steps involved in it

Get step-by-step solutions from verified subject matter experts