

Question: Q3a: The experimental data in Table 2 shows the concentration of reactant A in time. Time t [s] Concentration CA mol L-') 10 0 20
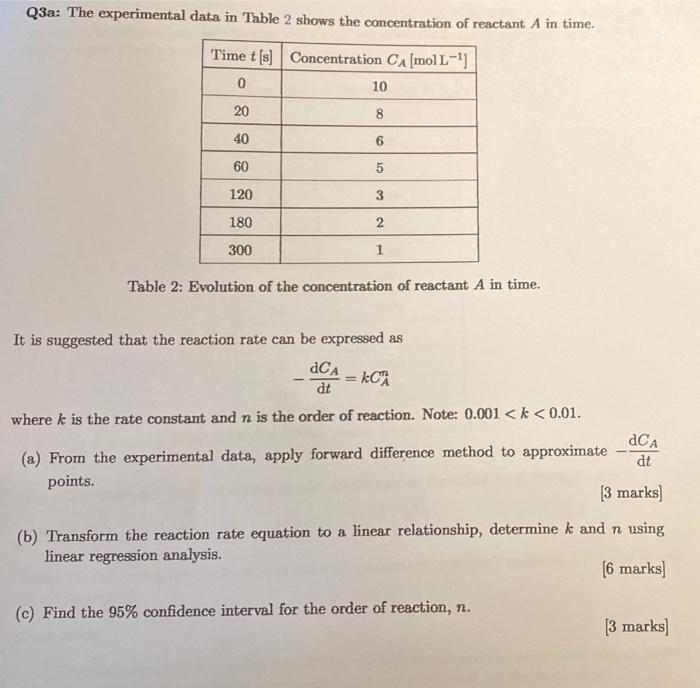
Q3a: The experimental data in Table 2 shows the concentration of reactant A in time. Time t [s] Concentration CA mol L-') 10 0 20 8 40 6 60 5 120 3 180 2 300 1 Table 2: Evolution of the concentration of reactant A in time. It is suggested that the reaction rate can be expressed as dCA - KCA dt where k is the rate constant and n is the order of reaction. Note: 0.001
Step by Step Solution
There are 3 Steps involved in it
1 Expert Approved Answer
Step: 1 Unlock

Question Has Been Solved by an Expert!
Get step-by-step solutions from verified subject matter experts
Step: 2 Unlock
Step: 3 Unlock