

Question: Q4. Consider historical data showing that the average annual rate of return on the S&P portfolio over the past 90 years has averaged roughly 8%
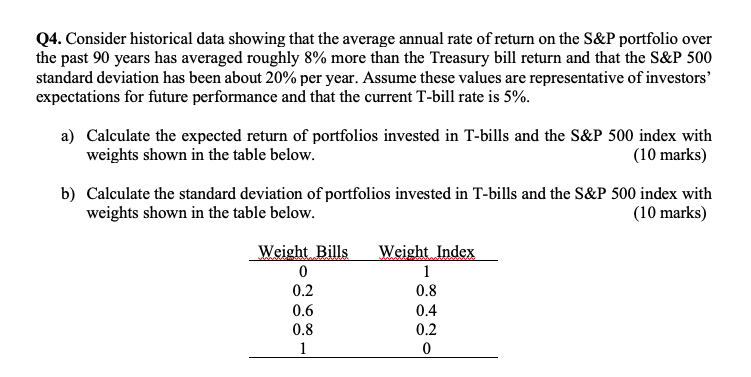
Q4. Consider historical data showing that the average annual rate of return on the S&P portfolio over the past 90 years has averaged roughly 8% more than the Treasury bill return and that the S&P 500 standard deviation has been about 20% per year. Assume these values are representative of investors' expectations for future performance and that the current T-bill rate is 5%. a) Calculate the expected return of portfolios invested in T-bills and the S&P 500 index with weights shown in the table below. (10 marks) b) Calculate the standard deviation of portfolios invested in T-bills and the S&P 500 index with weights shown in the table below. (10 marks) Weight Bills 0 0.2 0.6 0.8 1 Weight Index 1 0.8 0.4 0.2 0
Step by Step Solution
There are 3 Steps involved in it

Get step-by-step solutions from verified subject matter experts