

Question: Q4 Table 1 below contains data for Singapore in 2011 and 2012 obtained from the Department of Statistics' Yearbook of Statistics 2018 (link to PDF).
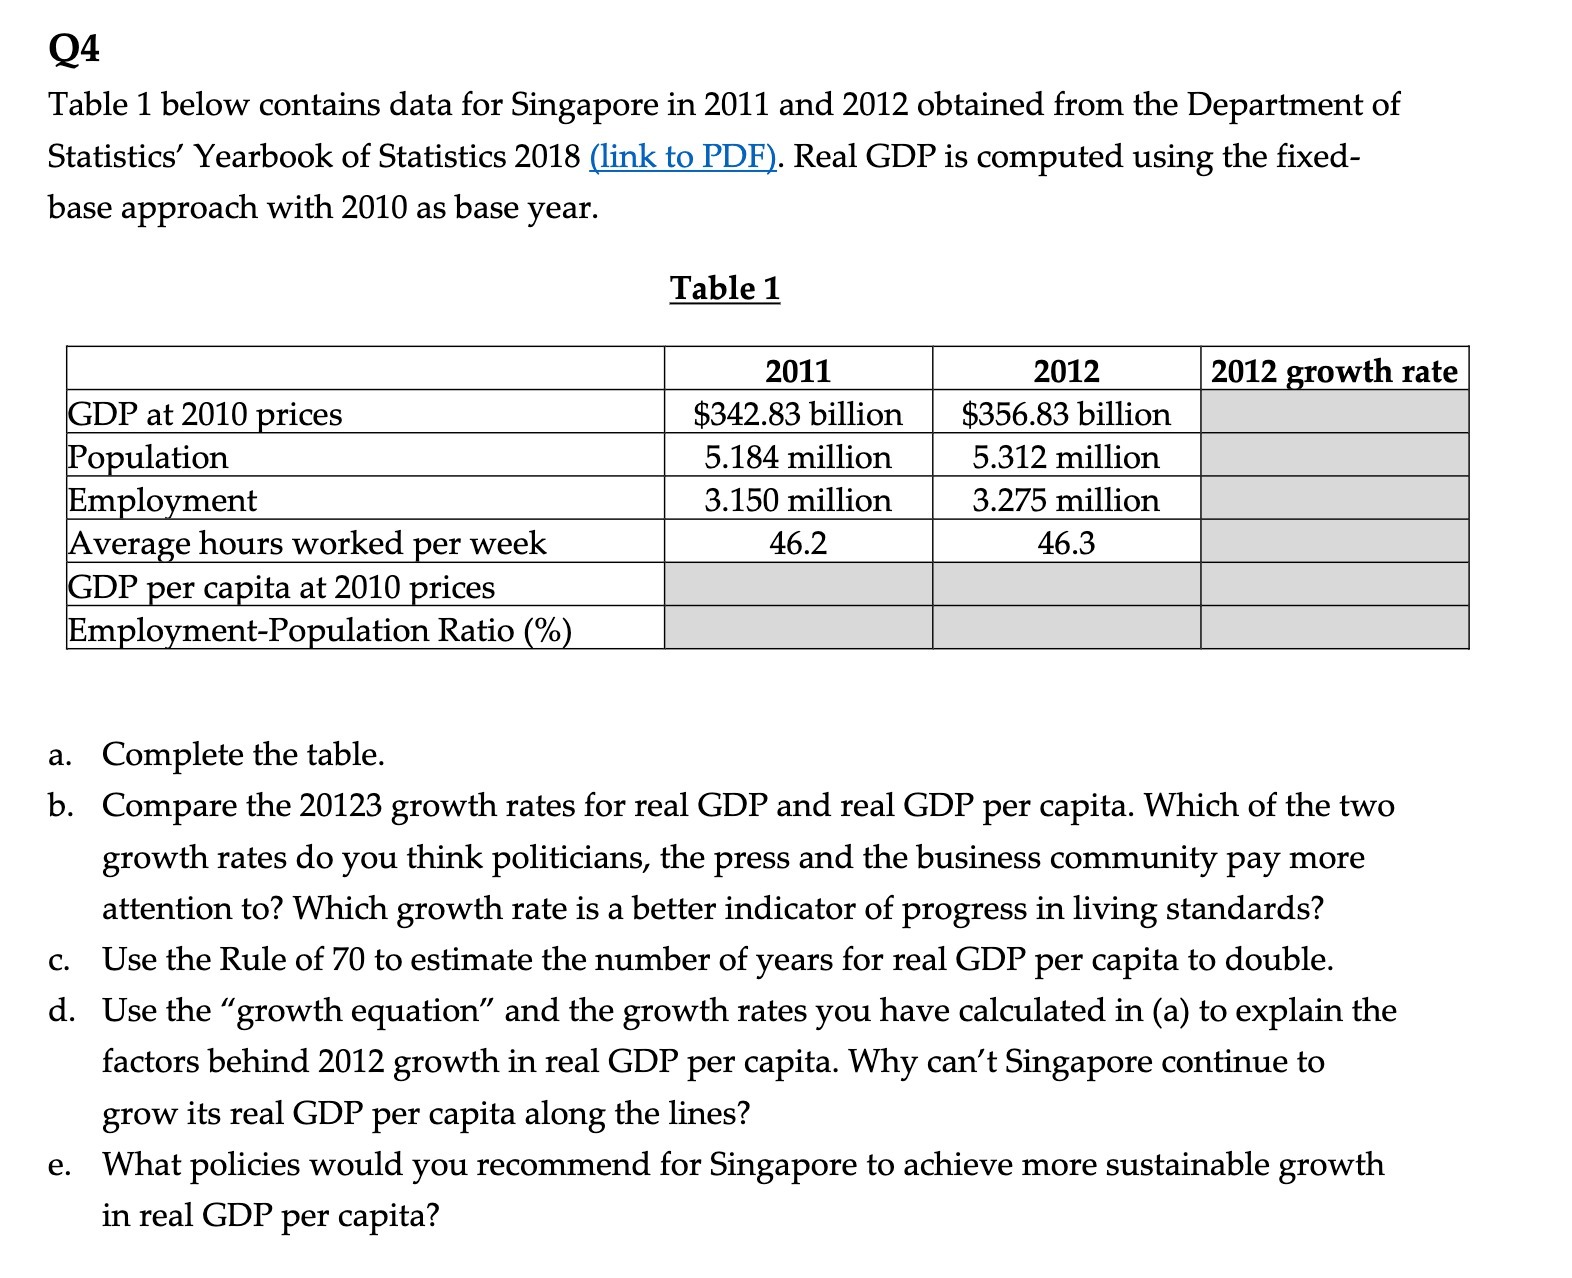
Q4 Table 1 below contains data for Singapore in 2011 and 2012 obtained from the Department of Statistics' Yearbook of Statistics 2018 (link to PDF). Real GDP is computed using the fixed- base approach with 2010 as base year. Table 1 2011 2012 2012 growth rate GDP at 2010 prices $342.83 billion $356.83 billion Population 5.184 million 5.312 million Employment 3.150 million 3.275 million Average hours worked per week 46.2 46.3 GDP per capita at 2010 prices Employment-Population Ratio (%) a. Complete the table. b. Compare the 20123 growth rates for real GDP and real GDP per capita. Which of the two growth rates do you think politicians, the press and the business community pay more attention to? Which growth rate is a better indicator of progress in living standards? c. Use the Rule of 70 to estimate the number of years for real GDP per capita to double. d. Use the "growth equation" and the growth rates you have calculated in (a) to explain the factors behind 2012 growth in real GDP per capita. Why can't Singapore continue to grow its real GDP per capita along the lines? e. What policies would you recommend for Singapore to achieve more sustainable growth in real GDP per capita
Step by Step Solution
There are 3 Steps involved in it

Get step-by-step solutions from verified subject matter experts