

Question: Q5. Plot four hyperbolic functions by matplotlib: y = sinh(x), y = cosh(x), y=tanh(x) and y = sech(2). The final result may look like (NOT
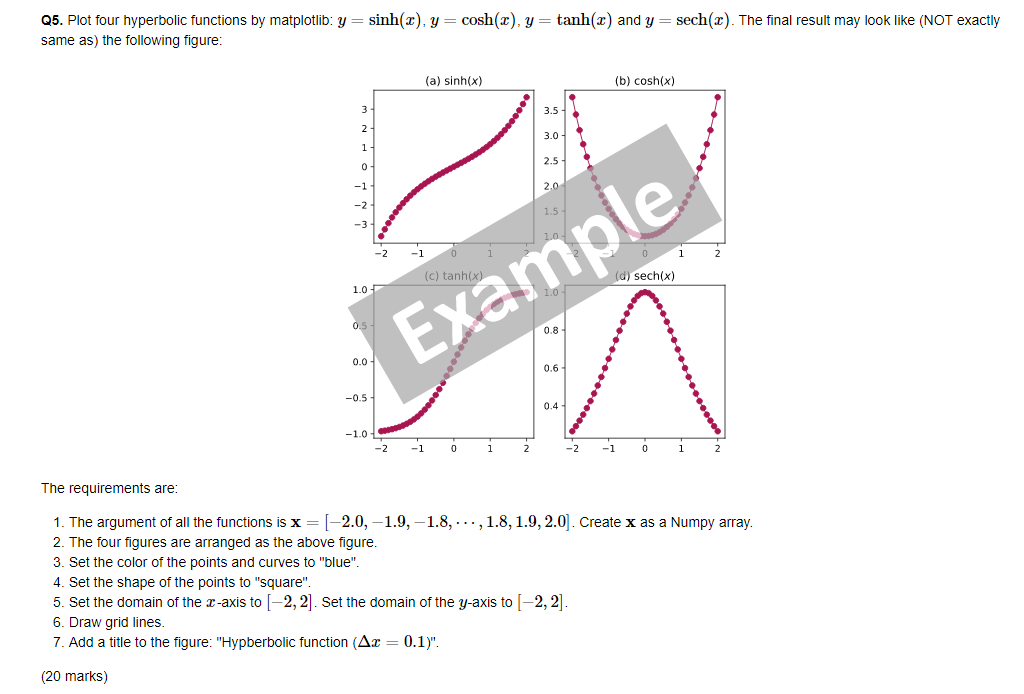
Q5. Plot four hyperbolic functions by matplotlib: y = sinh(x), y = cosh(x), y=tanh(x) and y = sech(2). The final result may look like (NOT exactly same as) the following figure: (a) sinh(x) (b) cos(x) 3 3.5 2 3.0 1 2.5 0 2.0 -2 -2 (d) sech(x) 1.01 05 0.8 Example 0.0 0.6 -0.5 0.4 -1.0 -2 - 1 0 1 2 -2 -1 0 i The requirements are: 1. The argument of all the functions is x = [-2.0, -1.9,-1.8, ..., 1.8, 1.9, 2.0). Create x as a Numpy array. 2. The four figures are arranged as the above figure. 3. Set the color of the points and curves to "blue". 4. Set the shape of the points to "square". 5. Set the domain of the x-axis to [-2, 2). Set the domain of the y-axis to [-2, 2]. 6. Draw grid lines. 7. Add a title to the figure: "Hyperbolic function (Az = 0.1)". (20 marks)
Step by Step Solution
There are 3 Steps involved in it

Get step-by-step solutions from verified subject matter experts