

Question: {Q-6} (11 Points) Using FDATool, design in Matlab a 4th order IIR bandpass filter with a cutoff frequencies of 1 kHz and 2.5 kHz and
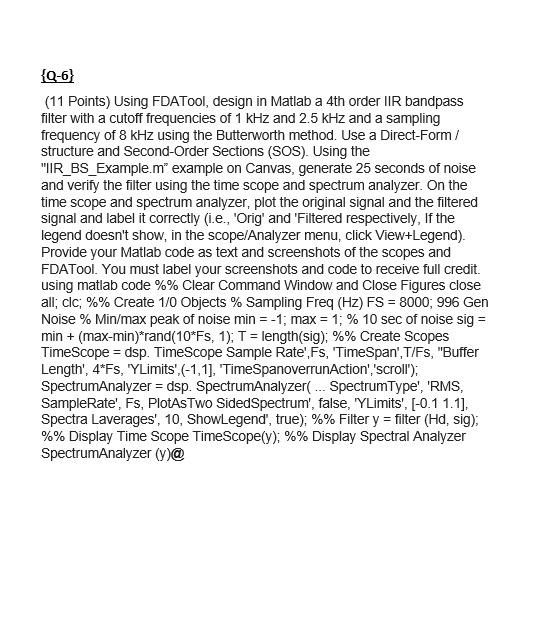
{Q-6} (11 Points) Using FDATool, design in Matlab a 4th order IIR bandpass filter with a cutoff frequencies of 1 kHz and 2.5 kHz and a sampling frequency of 8 kHz using the Butterworth method. Use a Direct-Form/ structure and Second-Order Sections (SOS). Using the "IIR_BS_Example.m" example on Canvas, generate 25 seconds of noise and verify the filter using the time scope and spectrum analyzer. On the time scope and spectrum analyzer, plot the original signal and the filtered signal and label it correctly (i.e., 'Orig' and 'Filtered respectively, If the legend doesn't show, in the scope/Analyzer menu, click View+Legend). Provide your Matlab code as text and screenshots of the scopes and FDATool. You must label your screenshots and code to receive full credit. using matlab code %% Clear Command Window and Close Figures close all; clc; %% Create 1/0 Objects % Sampling Freq (Hz) FS = 8000; 996 Gen Noise % Min/max peak of noise min = -1; max = 1; % 10 sec of noise sig = min + (max-min)*rand(10*Fs, 1); T = length(sig); %% Create Scopes TimeScope = dsp. TimeScope Sample Rate',Fs, 'TimeSpan', T/Fs, "Buffer Length', 4*Fs, 'YLimits',(-1,1], 'TimeSpanoverrunAction','scroll"); SpectrumAnalyzer = dsp. SpectrumAnalyzer... SpectrumType', 'RMS, SampleRate', Fs, PlotAsTwo SidedSpectrum', false, 'YLimits', (-0.1 1.1), Spectra Laverages', 10, ShowLegend', true); %% Filter y = filter (Hd, sig) %% Dis Time Scope TimeScope(y); %% Spectral Analyzer SpectrumAnalyzer (y)@
Step by Step Solution
There are 3 Steps involved in it

Get step-by-step solutions from verified subject matter experts