

Question: Q7. Linear Regression Consider the following data for a multiple regression model relating housing prices (in thousands of dollars) to the number of bedrooms in

Q7. Linear Regression
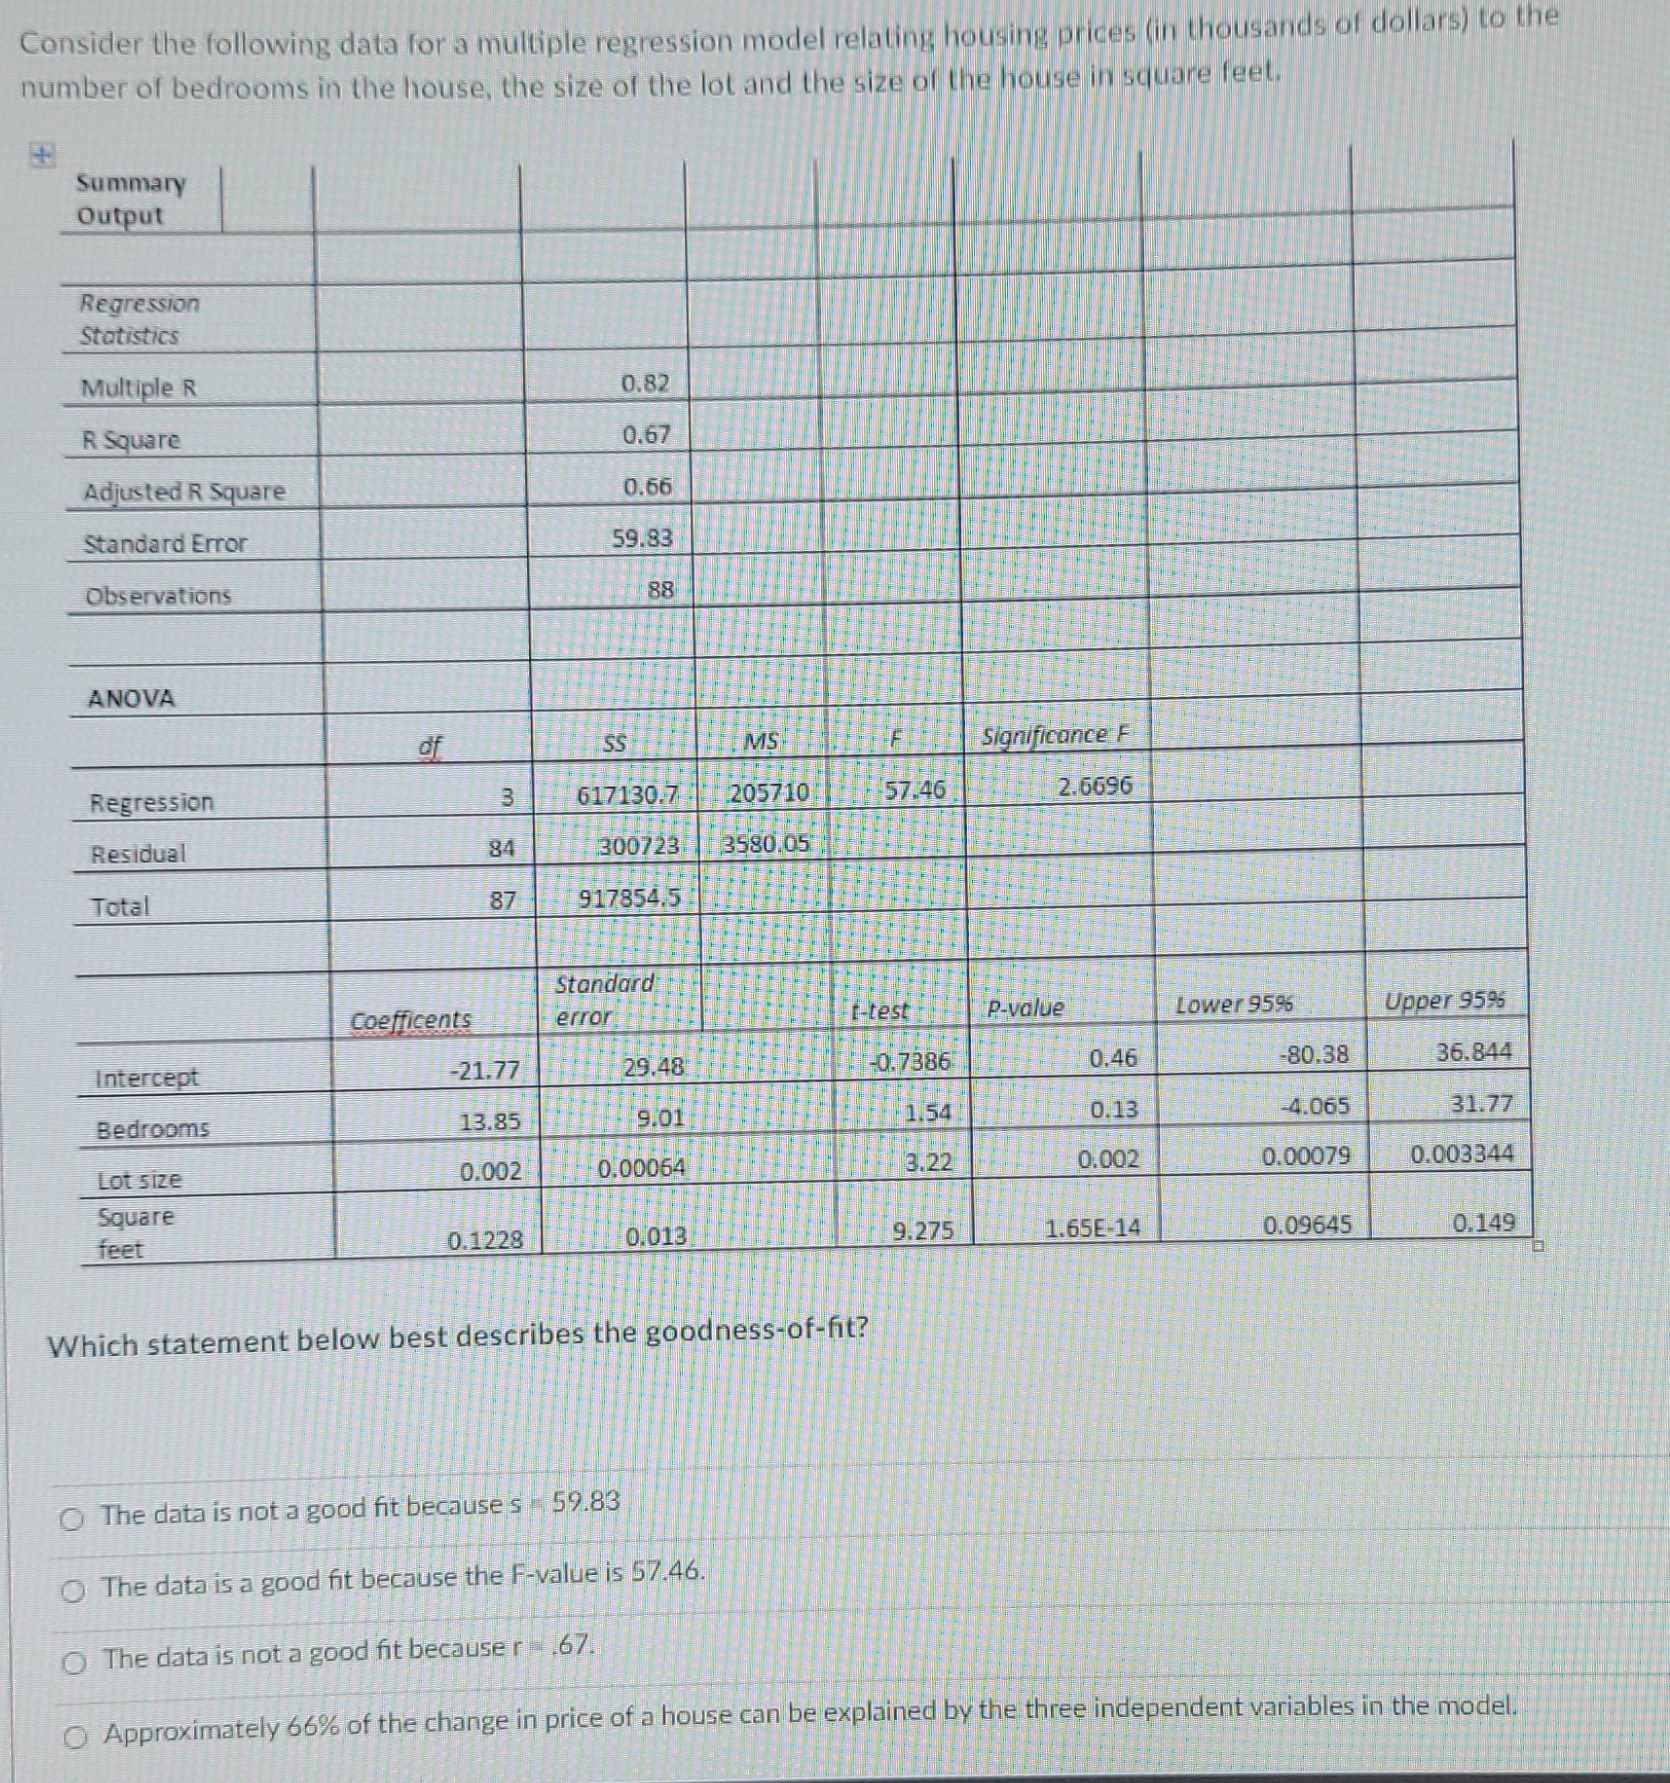
Consider the following data for a multiple regression model relating housing prices (in thousands of dollars) to the number of bedrooms in the house, the size of the lot and the size of the house in square feet. Summary Output Regression Statistics Multiple R 0.8: R Square 0.67 Adjusted R Square 0.66 Standard Error 59.83 Observations 88 ANOVA of SS MS Significance F Regression 3 617130.7 205710 7.46 2.6696 Residual 84 300723 3580.05 Total 87 917854.5 Standard Coefficents error t-test p-value Lower 9595 Upper 9595 Intercept -21.77 29.48 -0. 7386 0.46 -80.38 36.844 Bedrooms 13.85 9.01 1.54 0.13 -4.065 31.77 Lot size 0.002 0.00064 3.22 0.002 0.00079 0.003344 Square feet 0.1228 0.013 9.275 1.65E-14 0.09645 0.149 Which statement below best describes the goodness-of-fit? The data is not a good fit because s - 59.83 The data is a good fit because the F-value is 57.46. O The data is not a good fit because r - .67. O Approximately 66% of the change in price of a house can be explained by the three independent variables in the model
Step by Step Solution
There are 3 Steps involved in it

Get step-by-step solutions from verified subject matter experts