

Question: Q7. The following table shows the part-machine processing indicator matrix. Determine machine groups and part families for the data using Similarity Coefficient (SC) algorithm. Use
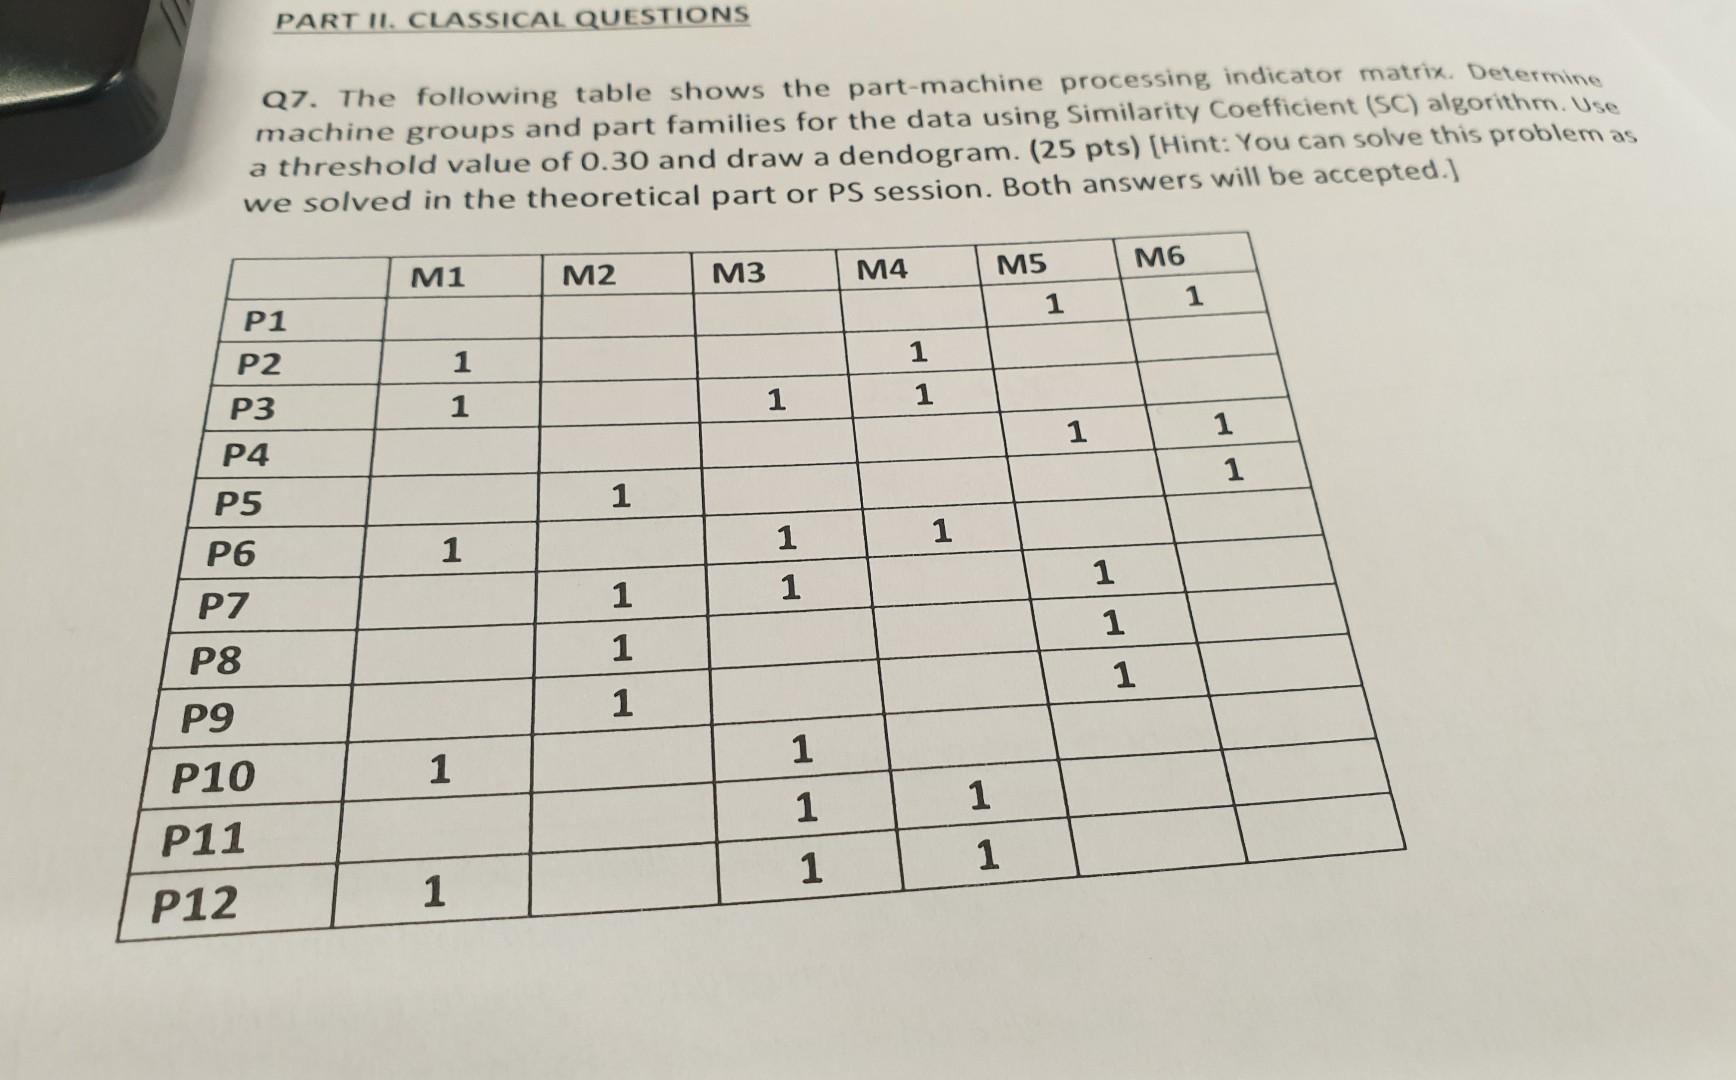
Q7. The following table shows the part-machine processing indicator matrix. Determine machine groups and part families for the data using Similarity Coefficient (SC) algorithm. Use a threshold value of 0.30 and draw a dendogram. (25 pts) [Hint: You can solve this problem as we solved in the theoretical part or PS session. Both answers will be accepted.)
Step by Step Solution
There are 3 Steps involved in it
1 Expert Approved Answer
Step: 1 Unlock

Question Has Been Solved by an Expert!
Get step-by-step solutions from verified subject matter experts
Step: 2 Unlock
Step: 3 Unlock