Question: Q1. A crossover chart for process selection focuses on: (3 pts) (A) Labor costs (B) Material cost (C) Both labor and material costs (D) Fixed
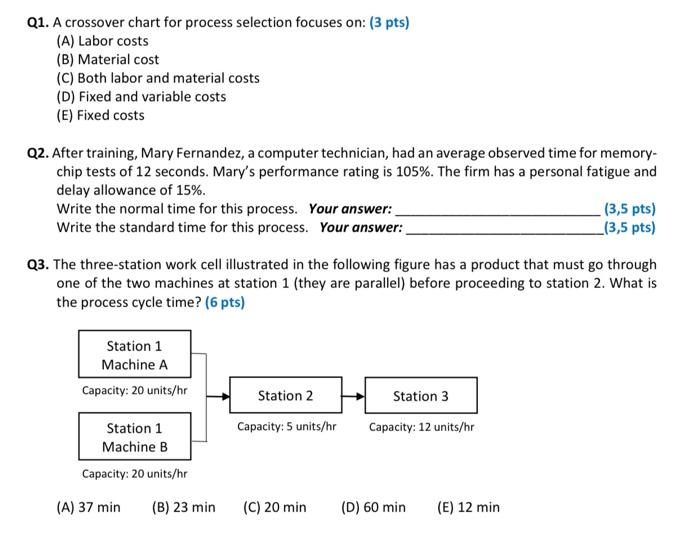
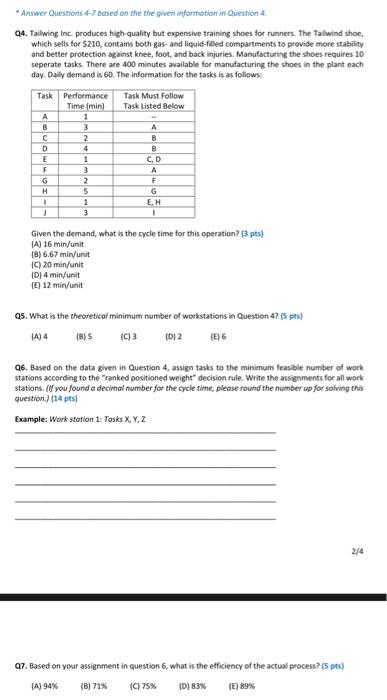
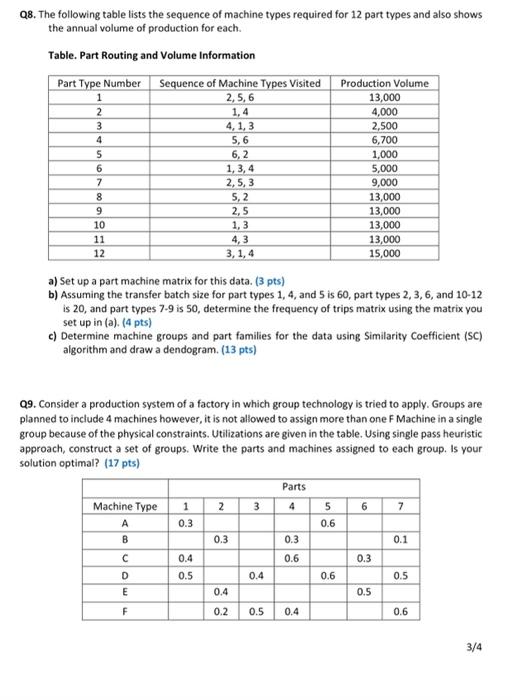
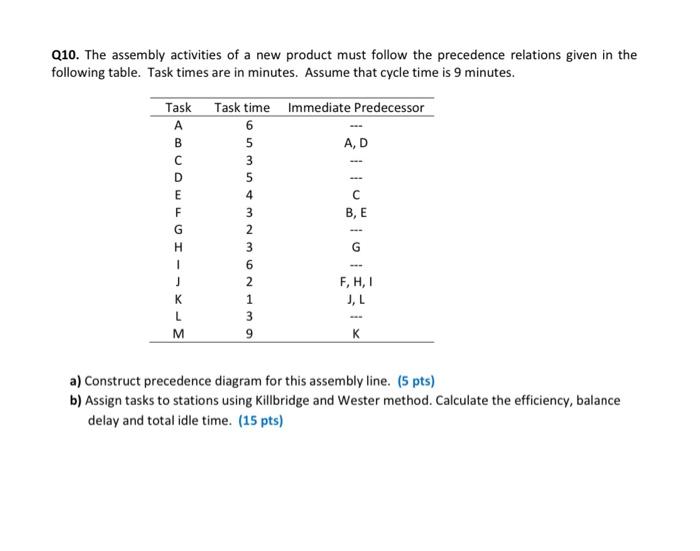
Q1. A crossover chart for process selection focuses on: (3 pts) (A) Labor costs (B) Material cost (C) Both labor and material costs (D) Fixed and variable costs (E) Fixed costs Q2. After training, Mary Fernandez, a computer technician, had an average observed time for memory- chip tests of 12 seconds. Mary's performance rating is 105%. The firm has a personal fatigue and delay allowance of 15%. Write the normal time for this process. Your answer: (3,5 pts) Write the standard time for this process. Your answer: (3,5 pts) Q3. The three-station work cell illustrated in the following figure has a product that must go through one of the two machines at station 1 (they are parallel) before proceeding to station 2. What is the process cycle time? (6 pts) Station 1 Machine A Capacity: 20 units/hr Station 2 Capacity: 5 units/hr Station 3 Capacity: 12 units/hr Station 1 Machine B Capacity: 20 units/hr (A) 37 min (B) 23 min (C) 20 min (D) 60 min (E) 12 min *Answer Questions 4-7 based on the the given information in Question 4. Q4. Tailwing Inc. produces high quality but expensive training shoes for runners. The Tailwind shoe, which sells for $210, contains both gas- and liquid-filled compartments to provide more stability and better protection against knee, foot, and back injuries. Manufacturing the shoes requires 10 seperate tasks. There are 400 minutes available for manufacturing the shoes in the plant each day. Dally demand is 60. The information for the tasks is as follows: Task Must Follow Task Listed Below A Task Performance Time min) A 1 B 3 C 2 D 4 E 1 F 3 2 H 5 1 1 1 3 8 B CD A F G EH 1 Given the demand, what is the cycle time for this operation? (3 pts} (A) 16 min/unit 18) 6.67 min/unit (C) 20 min/unit (D) 4 min/unit (E) 12 min/unit 25. What is the theoretical minimum number of workstations in Question 4? (5 ps) (A) 4 (8) (C)3 D]2 (E) 06. Based on the data given in Question 4, assign tasks to the minimum feasible number of work stations according to the "ranked positioned weight decision rule. Write the assignments for all work stations. If you found a decimal number for the cycle time, please round the number up for solving this question. (14 pts) Example: Work station 1: Tasks X Y Z 2/4 Q7. Based on your assignment in question 6, what is the efficiency of the actual process? (5 pts) (A) 94% (B) 71% (C) 75% 10) 83% Q8. The following table lists the sequence of machine types required for 12 part types and also shows the annual volume of production for each. Table. Part Routing and Volume Information Part Type Number Sequence of Machine Types Visited Production Volume 2,5,6 13,000 1,4 4,000 4,1,3 2,500 5,6 6,700 6,2 1,000 1,3,4 5,000 2,5, 3 9,000 5,2 13,000 2,5 13,000 1,3 13,000 4,3 13,000 3,1,4 15,000 1 2 3 4 5 6 7 8 9 10 11 12 a) Set up a part machine matrix for this data. (3 pts) b) Assuming the transfer batch size for part types 1, 4, and 5 is 60, part types 2,3,6, and 10-12 is 20, and part types 7-9 is 50, determine the frequency of trips matrix using the matrix you set up in (a). (4 pts) c) Determine machine groups and part families for the data using Similarity Coefficient (SC) algorithm and draw a dendogram (13 pts) 09. Consider a production system of a factory in which group technology is tried to apply. Groups are planned to include 4 machines however, it is not allowed to assign more than one F Machine in a single group because of the physical constraints. Utilizations are given in the table. Using single pass heuristic approach, construct a set of groups. Write the parts and machines assigned to each group. Is your solution optimal? (17 pts) Parts Machine Type 2 3 1 3 4 6 7 5 0.6 0.3 B 0.3 0.3 0.1 0.6 0.3 0.4 0.5 D 0.4 0.6 0.5 E 0.4 0.5 F 0.2 0.5 0.4 0.6 3/4 Q10. The assembly activities of a new product must follow the precedence relations given in the following table. Task times are in minutes. Assume that cycle time is 9 minutes. Task time 6 Immediate Predecessor AD Task A B D E F G BE 5 4 3 2 3 6 2 1 3 9 1 F, H, 1 J, L K L M a) Construct precedence diagram for this assembly line. (5 pts) b) Assign tasks to stations using Killbridge and Wester method. Calculate the efficiency, balance delay and total idle time. (15 pts)