

Question: Q.No.4. Here you can see a Ramachandran plot. Please interpret the quality of the protein model using this plot. (3 Marks) 1978 180 135
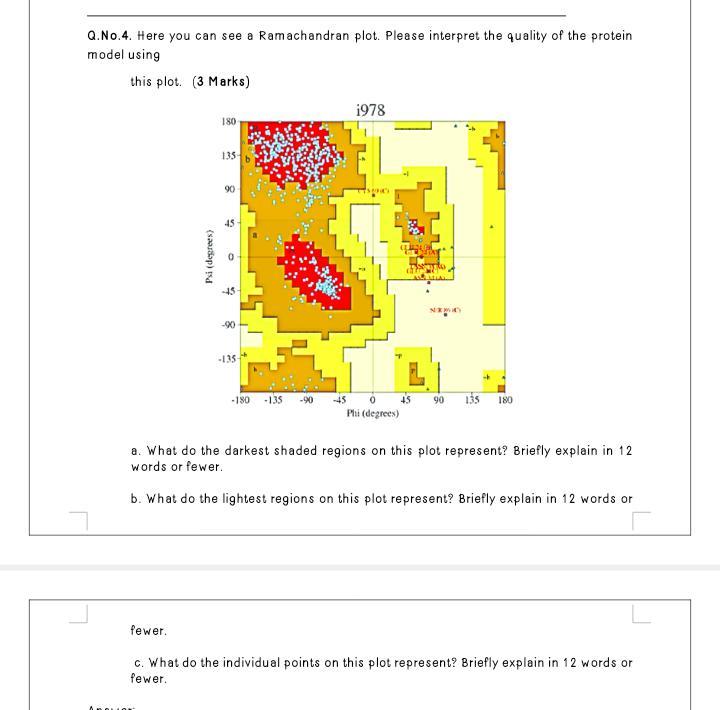
Q.No.4. Here you can see a Ramachandran plot. Please interpret the quality of the protein model using this plot. (3 Marks) 1978 180 135 90 45 45 -90 135 -180 -135 -90 -45 0 4S 90 135 180 Phi (degrees) a. What do the darkest shaded regions on this plot represent? Briefly explain in 12 words or fewer. b. What do the lightest regions on this plot represent? Briefly explain in 12 words or fewer. c. What do the individual points on this plot represent? Briefly explain in 12 words or fewer. (saarap) sa
Step by Step Solution
3.55 Rating (165 Votes )
There are 3 Steps involved in it
A Ramachandran plot illustrates the statistical allotment of a mixture of dihedral angles of backbon... View full answer

Get step-by-step solutions from verified subject matter experts