

Question: QS 18-3 Cost behavior estimation-high-low method LOP1 QS 18-5 Contribution margin ratio LO A1 Compute the contribution margin ratio using the following data: sales, $4,800;
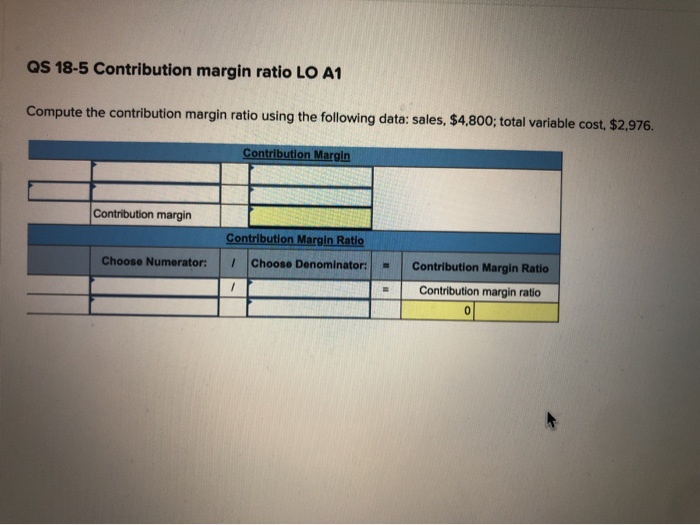
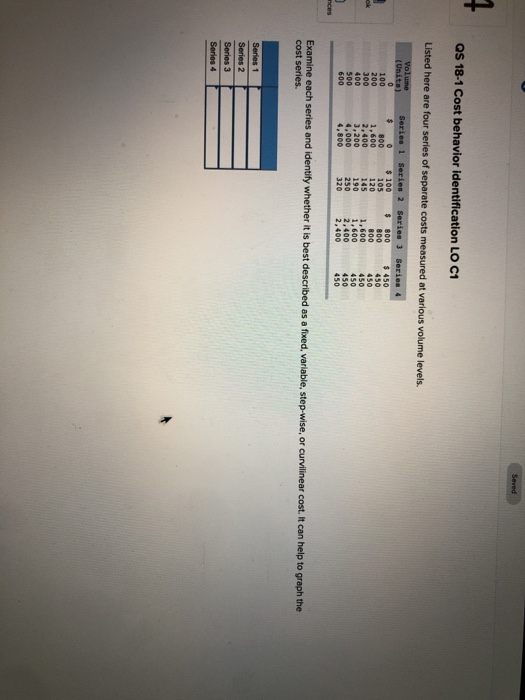
QS 18-5 Contribution margin ratio LO A1 Compute the contribution margin ratio using the following data: sales, $4,800; total variable cost, $2.976. Contribution Margin Contribution margin Contribution Margin Ratio Choose Denominator: Choose Numerator: Contribution Margin Ratio Contribution margin ratio 0 QS 18-1 Cost behavior identification LO C1 Listed here are four series of separate costs measured at various volume levels. Volume (Units) Series 1 Series 2 Series 3 Series 4 $ 450 100 800 800 2,400 3,200 4,000 1,600 1,600 250 320 2.400 450 450 Examine each series and identify whether it is best described as a fixed, variable, step-wise, or curvilinear cost. It can help to graph the cost series. Series 1 Series 2 Series 3 Series 4
Step by Step Solution
There are 3 Steps involved in it

Get step-by-step solutions from verified subject matter experts