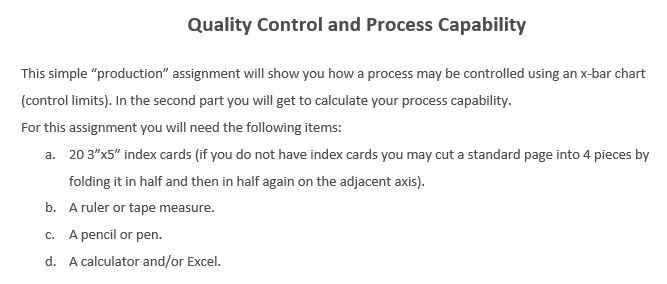
Question: Quality Control and Process Capability This simple production assignment will show you how a process may be controlled using an x-bar chart (control limits). In

Quality Control and Process Capability This

Quality Control and Process Capability This

Quality Control and Process Capability This

Quality Control and Process Capability ThisQuality Control and Process Capability This

Quality Control and Process Capability This simple "production" assignment will show you how a process may be controlled using an x-bar chart (control limits). In the second part you will get to calculate your process capability. For this assignment you will need the following items: a. 2035 index cards (if you do not have index cards you may cut a standard page into 4 pieces by folding it in half and then in half again on the adjacent axis). b. A ruler or tape measure. c. A pencil or pen. d. A calculator and/or Excel. Part I - Study your process - data collection 1. Take an index card and draw a 10 centimeter line (4) on it (you may wish to study what a 10cm is beforehand). Do not use the ruler when drawing the line. 2. Repeat this with using 9 more cards (for a total of 10 cards). Remember, each line should be drawn independently without the use of any tools. 3. Take a picture of the 10 cards and attach it at the end of this assignment. 5. Calculate your process Mean (average) and Standard deviation (you may use Excel). Please see an example in the rightmost column. Note that in order to find the parameter of a process a much larger number of observations is required. We will also assume that your "products" are normally distributed. Part 2 - Control your process In this part you will see how consistent you process is; whether it is in-control or out-of-control. a. First, calculate your process Control-Limits. Since we are measuring length, we will use the x-bar chart. X-bar chart control limits: Note that in the next step you will be controlling the process using a sample of 4 items hence the control limits are calculated using n=4. b. Next, resume your operations and see if you process is consistent - in-control - or not. 1. Take the remaining 10 index cards and, as before, draw a 10 centimeter line on each one. Again, do not use the ruler when drawing the lines. 2. Randomly, choose 4 out of the 10 cards (take a sample of 4) and measure the length of the lines. Enter your data in the table below. 3. Take a picture of the 10cards, mark the 4 randomly selected, and attach it at the end of this assignment. 4. Calculate your Sample Mean (average). Please see an example in the rightmost column. c. Finally check if your sample mean is within your control limits. In the example the sample mean is below the Lower-Control-Limit (9.7

Step by Step Solution

There are 3 Steps involved in it

1 Expert Approved Answer
Step: 1 Unlock blur-text-image
Question Has Been Solved by an Expert!

Get step-by-step solutions from verified subject matter experts

Step: 2 Unlock
Step: 3 Unlock

Students Have Also Explored These Related General Management Questions!