

Question: Quality Control Assignment Read the attached sample EP Evaluator report. This report represents a very practical use of linear regression in the clinical laboratory. When
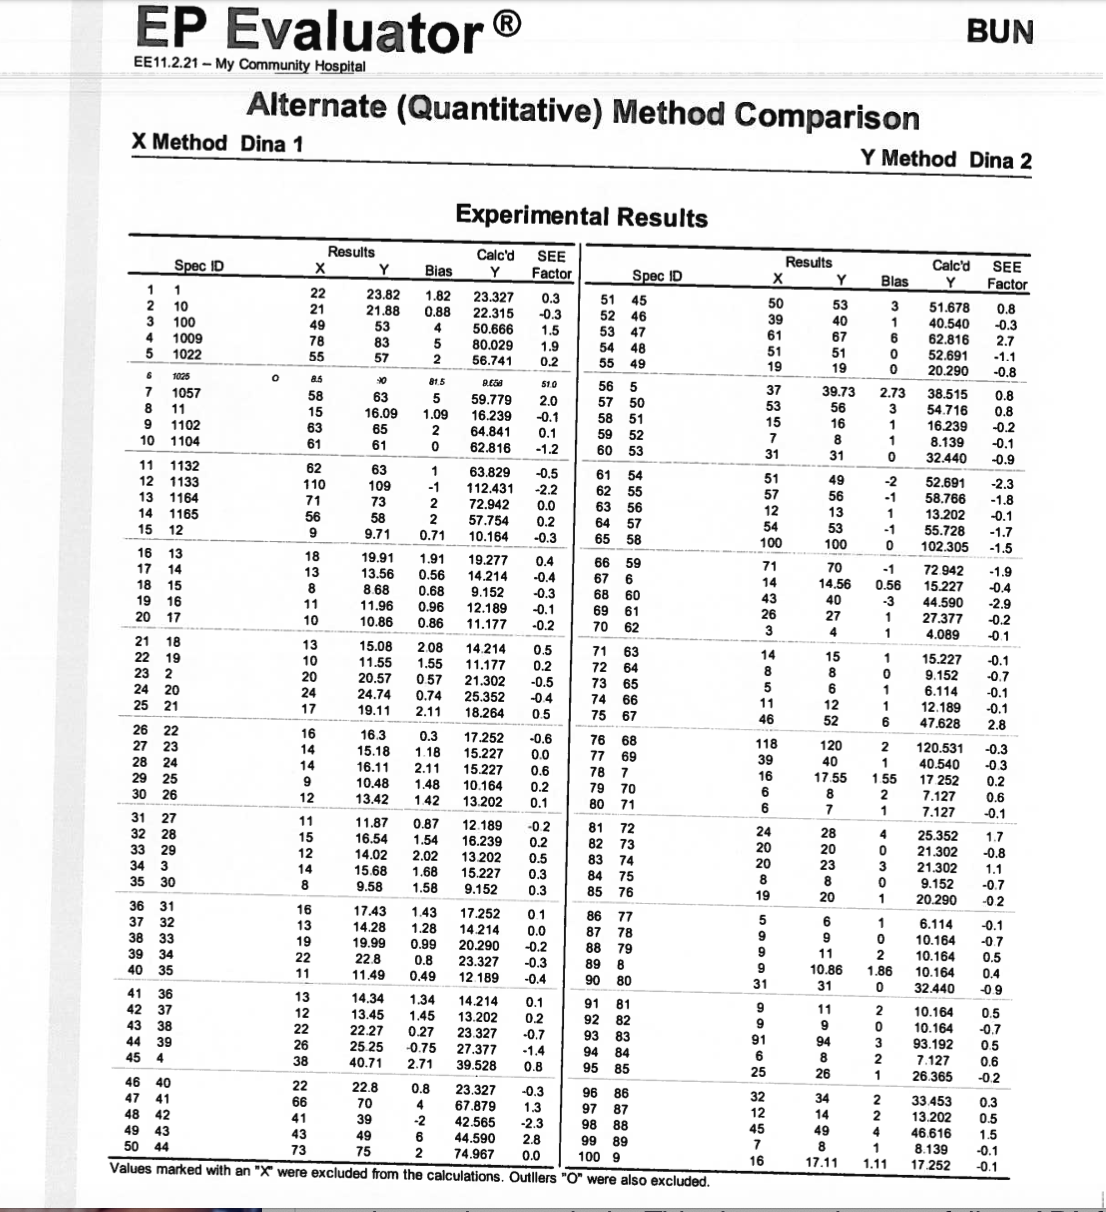
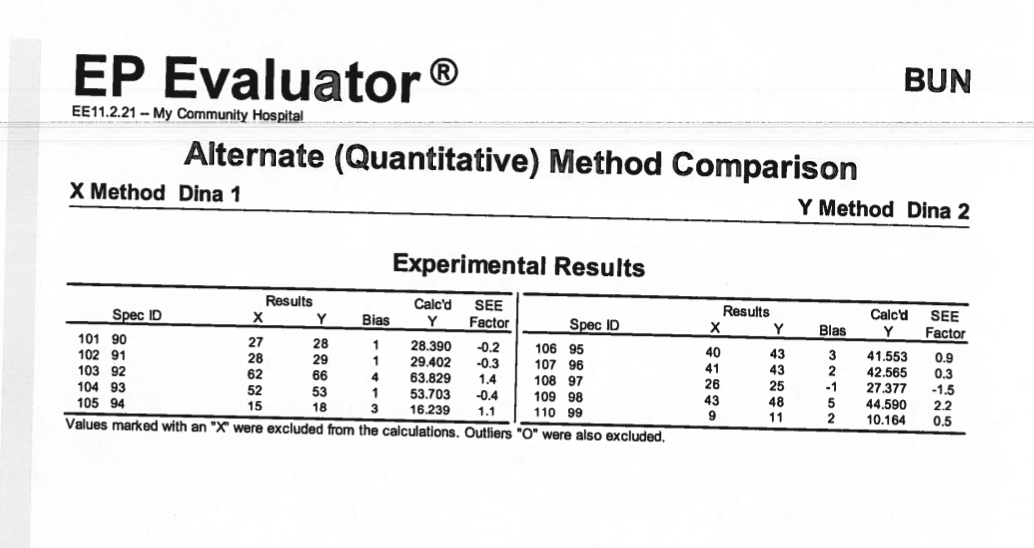
Quality Control Assignment Read the attached sample EP Evaluator report. This report represents a very practical use of linear regression in the clinical laboratory. When laboratorians acquire new instrumentation, they must diligently ensure the precision, accuracy and quality of patient results. The sample report shows the comparison of current instrumentation (Dina 1) and new instrumentation (Dina 2) for the determination of BUN (blood urea nitrogen, an analyte commonly tested for the evaluation of kidney function) in patients. For this assignment, your job is to pretend this report was just completed by your employee who is now seeking your approval or disapproval of instrumentation function. Using the results interpretation section provided as a guide, compose a short (limit one page) interpretation of results section. Specifically, comment on the Deming regression slope and intercept, correlation coefficient, sample size and effect of outlier results on data analysis. This does not have to follow APA format
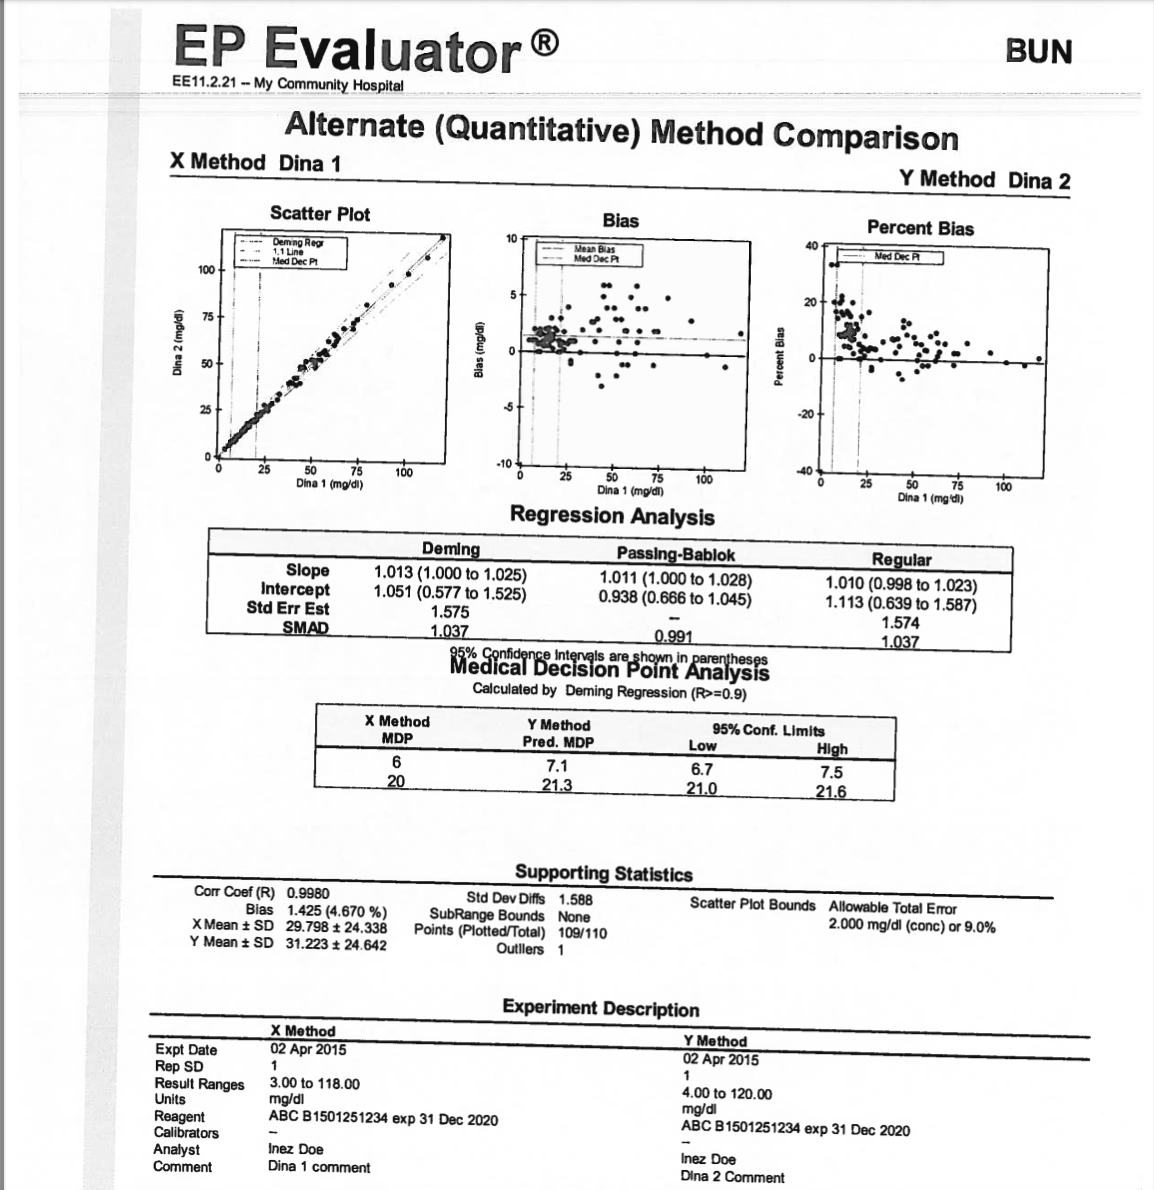
EP Evaluator BUN EE11.2.21 -- My Community Hospital Alternate (Quantitative) Method Comparison X Method Dina 1 Y Method Dina 2 Scatter Plot Bias Percent Bias - 1.1 Line Mean Blas Med Dec P ded Dec Pt 100 75 Bias (mg/al) Percent Bias Dina 2 (mg/di 50 50 100 .104 25 100 25 100 Dina 1 ( mg/di ) Dina 1 (moral) Dina 1 (mg 'd) Regression Analysis Deming Passing-Bablok Regular Slope 1.013 (1.000 to 1.025) 1.011 (1.000 to 1.028) 1.010 (0.998 to 1.023) Intercept 1.051 (0.577 to 1.525) 0.938 (0.666 to 1.045) 1.113 (0.639 to 1.587) Std Err Est 1.575 1.574 SMAD 1037 0.991 1.037 e Intervals are shown in parentheses % Sinai Decision Point Analysis Calculated by Deming Regression (R>=0.9) X Method Y Method 95% Conf. Limits MDP Pred. MDP Low High 6 7.1 6.7 7.5 20 21.3 21.0 21.6 Supporting Statistics Com Coef (R) 0.9980 Std Dev Diffs 1.58 Scatter Plot Bounds Allowable Total Error Bias 1.425 (4.670 %) SubRange Bounds None 2.000 mg/dl (conc) or 9.0% X Mean + SD 29.798 + 24.338 Points (Plotted/Total) 109/110 Y Mean + SD 31.223 + 24.642 Outllers 1 Experiment Description
Step by Step Solution
There are 3 Steps involved in it

Get step-by-step solutions from verified subject matter experts