

Question: Quality Improvement by Dale Besterfield (9th ed) Chapter 6 - Control Charts for Variables Question 26: Determine the trial central line and control limits for
Quality Improvement by Dale Besterfield (9th ed) Chapter 6 - Control Charts for Variables
Question 26: Determine the trial central line and control limits for median and range charts for the data of Table 6-2. Assume assignable causes for any out-of-control points and determine the revised central line and control lim- its. Compare the pattern of variation with the X and R charts in Figure 6-4.
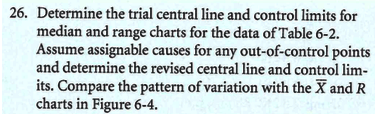
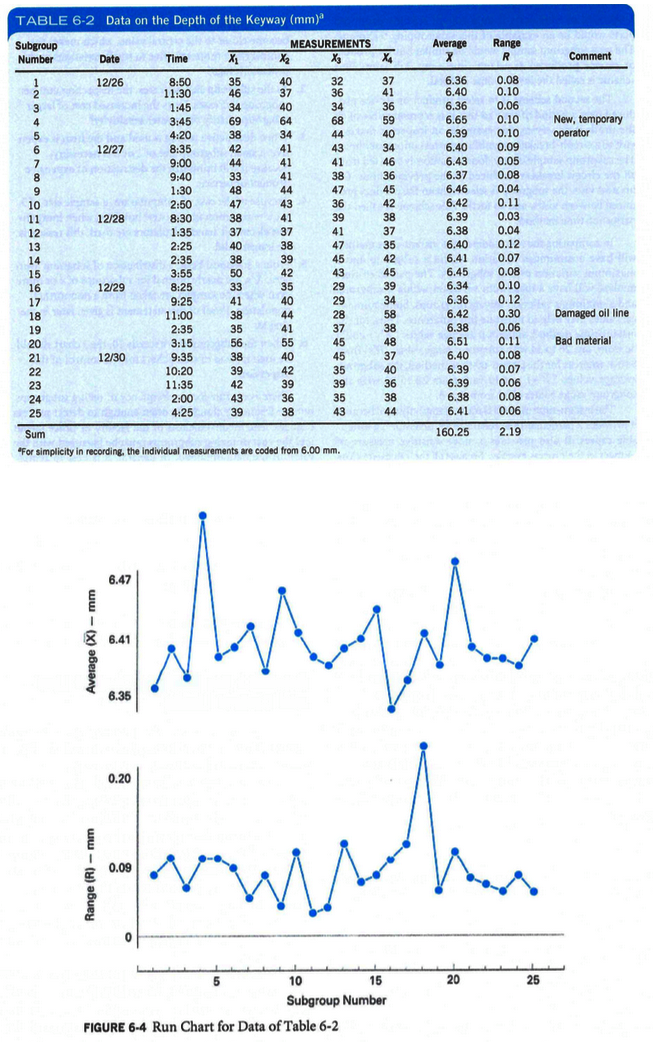
26. Determine the trial central line and control limits for median and range charts for the data of Table 6-2. Assume assignable causes for any out-of-control points and determine the revised central line and control lim- its. Compare the pattern of variation with the X and R charts in Figure 6-4. Average X Range R X4 Comment New, temporary operator TABLE 6-2 Data on the Depth of the Keyway (mm) Subgroup MEASUREMENTS Number Date Time XL X2 X3 1 12/26 8:50 35 40 32 2 11:30 46 37 36 3 1:45 34 40 34 4 3:45 69 64 68 5 4:20 38 34 44 6 12/27 8:35 42 41 43 7 9:00 44 41 41 8 9:40 33 41 38 9 1:30 48 44 47 10 2:50 47 43 36 11 12/28 8:30 38 41 39 12 1:35 37 37 41 13 2:25 40 38 47 14 2:35 38 39 45 15 3:55 50 42 43 16 12/29 8:25 33 35 29 17 9:25 41 40 29 18 11:00 38 44 28 19 2:35 35 41 37 20 3:15 56 55 45 21 12/30 9:35 38 40 45 22 10:20 39 42 35 23 11:35 42 39 39 24 2:00 43 36 35 25 4:25 39 38 43 37 41 36 59 40 34 46 36 45 42 38 37 35 42 45 39 34 58 38 48 37 40 36 38 44 6.36 6.40 6.36 6.65 6.39 6.40 6.43 6.37 6.46 6.42 6.39 6.38 6.40 6.41 6.45 6.34 6.36 6.42 6.38 6.51 6.40 6.39 6.39 6.38 6.41 0.08 0.10 0.06 0.10 0.10 0.09 0.05 0.08 0.04 0.11 0.03 0.04 0.12 0.07 0.08 0.10 0.12 0.30 0.06 0.11 0.08 0.07 0.06 0.08 0.06 Damaged oil line Bad material 160.25 2.19 Sum "For simplicity in recording, the individual measurements are coded from 6.00 mm. 6.47 X 6.41 6.36 0.20 0.09 20 25 5 10 15 Subgroup Number FIGURE 6-4 Run Chart for Data of Table 6-2 26. Determine the trial central line and control limits for median and range charts for the data of Table 6-2. Assume assignable causes for any out-of-control points and determine the revised central line and control lim- its. Compare the pattern of variation with the X and R charts in Figure 6-4. Average X Range R X4 Comment New, temporary operator TABLE 6-2 Data on the Depth of the Keyway (mm) Subgroup MEASUREMENTS Number Date Time XL X2 X3 1 12/26 8:50 35 40 32 2 11:30 46 37 36 3 1:45 34 40 34 4 3:45 69 64 68 5 4:20 38 34 44 6 12/27 8:35 42 41 43 7 9:00 44 41 41 8 9:40 33 41 38 9 1:30 48 44 47 10 2:50 47 43 36 11 12/28 8:30 38 41 39 12 1:35 37 37 41 13 2:25 40 38 47 14 2:35 38 39 45 15 3:55 50 42 43 16 12/29 8:25 33 35 29 17 9:25 41 40 29 18 11:00 38 44 28 19 2:35 35 41 37 20 3:15 56 55 45 21 12/30 9:35 38 40 45 22 10:20 39 42 35 23 11:35 42 39 39 24 2:00 43 36 35 25 4:25 39 38 43 37 41 36 59 40 34 46 36 45 42 38 37 35 42 45 39 34 58 38 48 37 40 36 38 44 6.36 6.40 6.36 6.65 6.39 6.40 6.43 6.37 6.46 6.42 6.39 6.38 6.40 6.41 6.45 6.34 6.36 6.42 6.38 6.51 6.40 6.39 6.39 6.38 6.41 0.08 0.10 0.06 0.10 0.10 0.09 0.05 0.08 0.04 0.11 0.03 0.04 0.12 0.07 0.08 0.10 0.12 0.30 0.06 0.11 0.08 0.07 0.06 0.08 0.06 Damaged oil line Bad material 160.25 2.19 Sum "For simplicity in recording, the individual measurements are coded from 6.00 mm. 6.47 X 6.41 6.36 0.20 0.09 20 25 5 10 15 Subgroup Number FIGURE 6-4 Run Chart for Data of Table 6-2
Step by Step Solution
There are 3 Steps involved in it

Get step-by-step solutions from verified subject matter experts