

Question: Quantitative Business Analysis Information/Data link for question --> https://drive.google.com/file/d/1XF3GqKw_rCyGhIJ6DrnR_PhaT0rZ_ZbJ/view?usp=sharing Question B (10 marks) - Stock Market Introduction The Capital Asset Pricing Model (CAPM) takes into
Quantitative Business Analysis
Information/Data link for question --> https://drive.google.com/file/d/1XF3GqKw_rCyGhIJ6DrnR_PhaT0rZ_ZbJ/view?usp=sharing
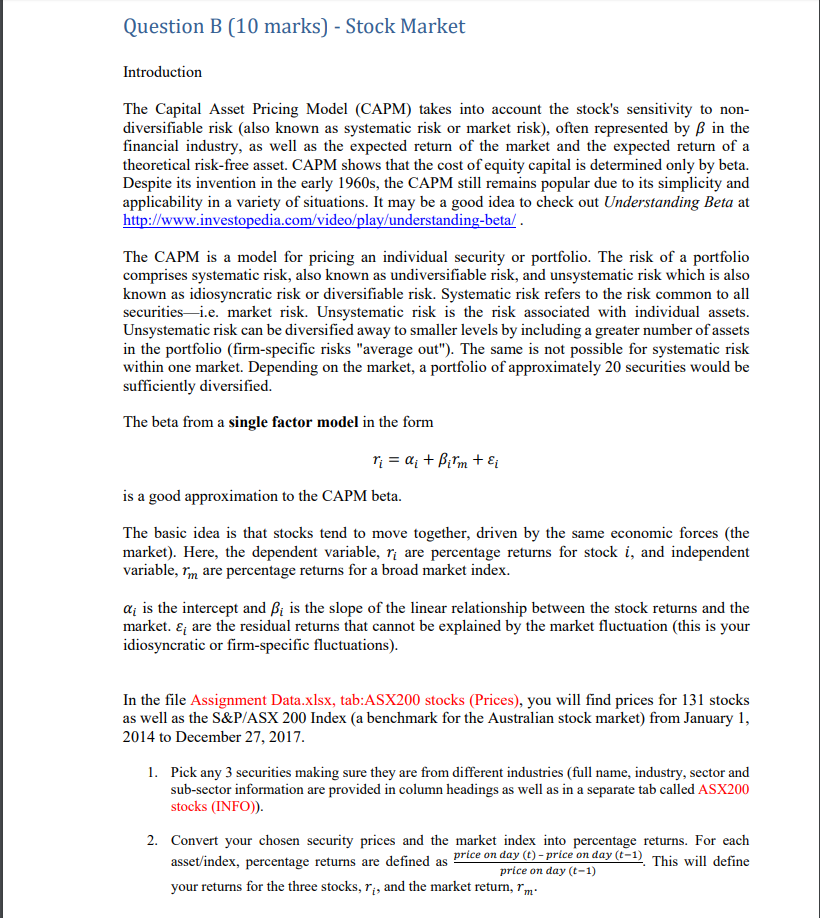
Question B (10 marks) - Stock Market Introduction The Capital Asset Pricing Model (CAPM) takes into account the stock's sensitivity to non- diversifiable risk (also known as systematic risk or market risk), often represented by ? in the financial industry, as well as the expected return of the market and the expected return of a theoretical risk-free asset. CAPM shows that the cost of equity capital is determined only by beta. Despite its invention in the early 1960s, the CAPM still remains popular due to its simplicity and applicability in a variety of situations. It may be a good idea to check out Understanding Beta at http://www.investopedia.com/video/play/understanding-beta/ The CAPM is a model for pricing an individual security or portfolio. The risk of a portfolio comprises systematic risk, also known as undiversifiable risk, and unsystematic risk which is also known as idiosyncratic risk or diversifiable risk. Systematic risk refers to the risk common to all securities-i.e. market risk. Unsystematic risk is the risk associated with individual assets. Unsystematic risk can be diversified away to smaller levels by including a greater number of assets in the portfolio (firm-specific risks "average out"). The same is not possible for systematic risk within one market. Depending on the market, a portfolio of approximately 20 securities would be sufficiently diversified. The beta from a single factor model in the form is a good approximation to the CAPM beta. The basic idea is that stocks tend to move together, driven by the same economic forces (the market). Here, the dependent variable, ri are percentage returns for stock i, and independent variable, m are percentage returns for a broad market index. ai is the intercept and Ai is the slope of the linear relationship between the stock returns and the market. ; are the residual returns that cannot be explained by the market fluctuation (this is your idiosyncratic or firm-specific fluctuations) In the file Assignment Data.xlsx, tab:ASX200 stocks (Prices), you will find prices for 131 stocks as well as the S&P/ASX 200 Index (a benchmark for the Australian stock market) from January 1, 2014 to December 27, 2017 1. Pick any 3 securities making sure they are from different industries (full name, industry, sector and sub-sector information are provided in column headings as well as in a separate tab called ASX200 stocks (INFO)) percentage returns. For each This will define 2. Convert your chosen security prices and the market index into asset/index, percentage returns are defined as price on day (-price on day ( your returns for the three stocks, ? , and the market return, r'm price on day (t-1)
Step by Step Solution
There are 3 Steps involved in it

Get step-by-step solutions from verified subject matter experts