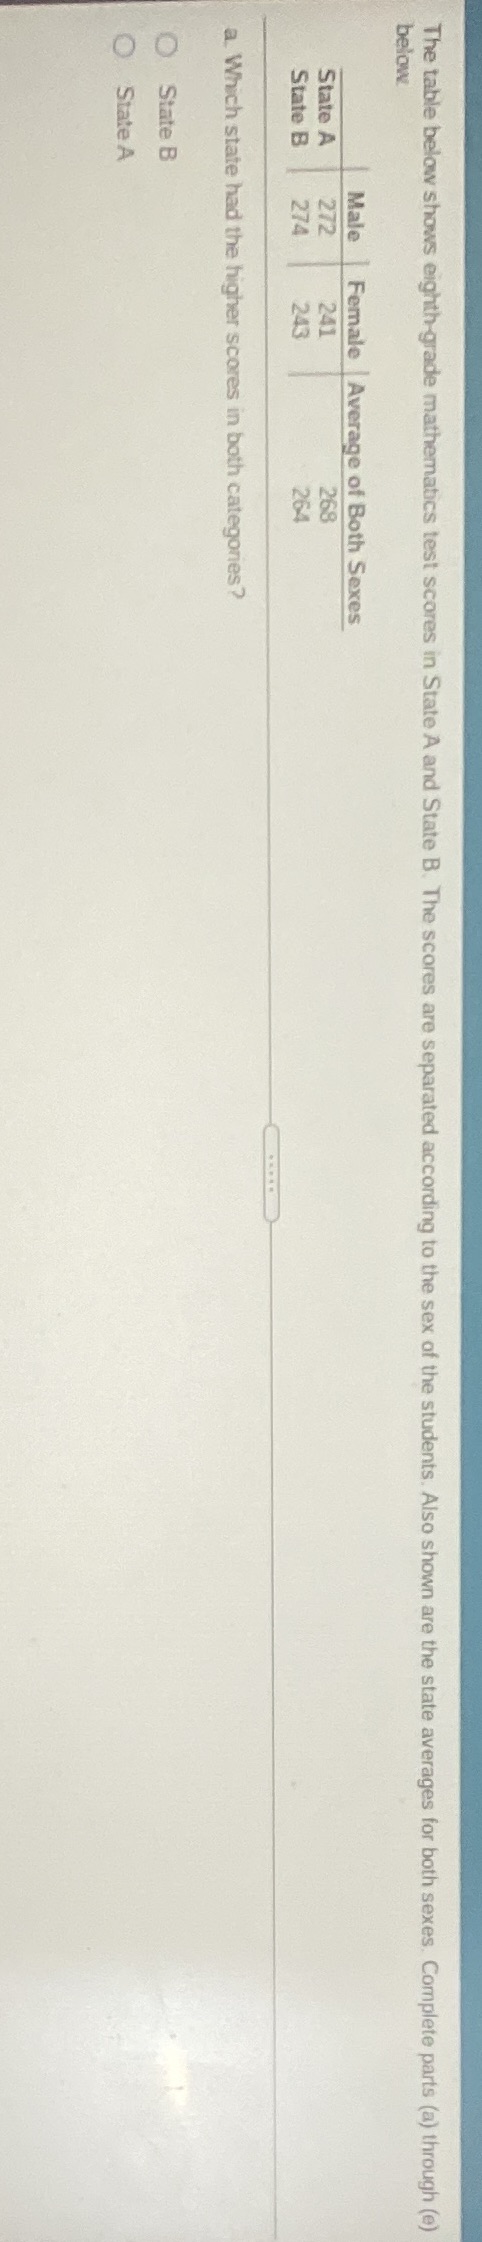
Question: Quantitative Explorations of Everyday Life The table below shows eighth-grade mathematics test scores in State A and State B. The scores are separated according to

Quantitative Explorations of Everyday Life

Quantitative Explorations of Everyday Life The
The table below shows eighth-grade mathematics test scores in State A and State B. The scores are separated according to the sex of the students. Also shown are the state averages for both sexes, Complete parts (a) through (e) below. Male Female Average of Both Sexes State A 272 241 268 State B 274 243 264 a. Which state had the higher scores in both categories? O State B O State A

Step by Step Solution

There are 3 Steps involved in it

1 Expert Approved Answer
Step: 1 Unlock blur-text-image
Question Has Been Solved by an Expert!

Get step-by-step solutions from verified subject matter experts

Step: 2 Unlock
Step: 3 Unlock

Students Have Also Explored These Related Mathematics Questions!