

Question: Test Scores. The table below shows eighth-grade mathematics test scores in Nebraska and New Jersey. The scores are separated according to the race of the
Test Scores. The table below shows eighth-grade mathematics test scores in Nebraska and New Jersey. The scores are separated according to the race of the student. Also shown are the state averages for all races.
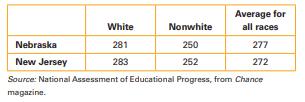
a. Which state had the higher scores in both racial categories? Which state had the higher overall average across both racial categories?
b. Explain how a state could score lower in both categories and still have a higher overall average.
c. Now consider the table below, which gives the percentages of whites and nonwhites in each state. Use these percentages to verify that the overall average test score in Nebraska is 277, as claimed in the first table.

d. Use the racial percentages to verify that the overall average test score in New Jersey is 272, as claimed in the first table.
e. Explain briefly, in your own words, how Simpson’s paradox appeared in this case.
Nebraska New Jersey White Nonwhite Average for all races 281 250 277 283 252 272 Source: National Assessment of Educational Progress, from Chance magazine.
Step by Step Solution
There are 3 Steps involved in it

Get step-by-step solutions from verified subject matter experts