

Question: Quantitative Method Analysis network distribution Please solve using solver on Excel solve please using the Values in the problem like Problem 10-07 (Algorithmic) Aggle Power
Quantitative Method Analysis network distribution
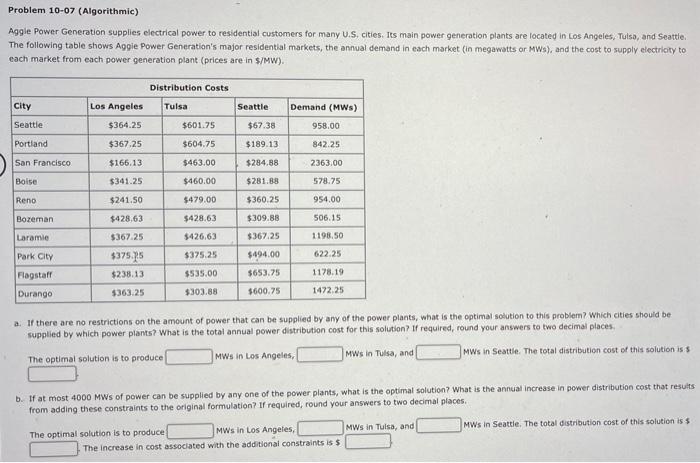
Please solve using solver on Excel solve please using the Values in the problem like
Step by Step Solution
There are 3 Steps involved in it
1 Expert Approved Answer
Step: 1 Unlock

Question Has Been Solved by an Expert!
Get step-by-step solutions from verified subject matter experts
Step: 2 Unlock
Step: 3 Unlock