

Question: Quantity demanded Instruction: Use the line tools provided to draw the supply curve (Supply) and demand curve (Demand) using the data in the table above.
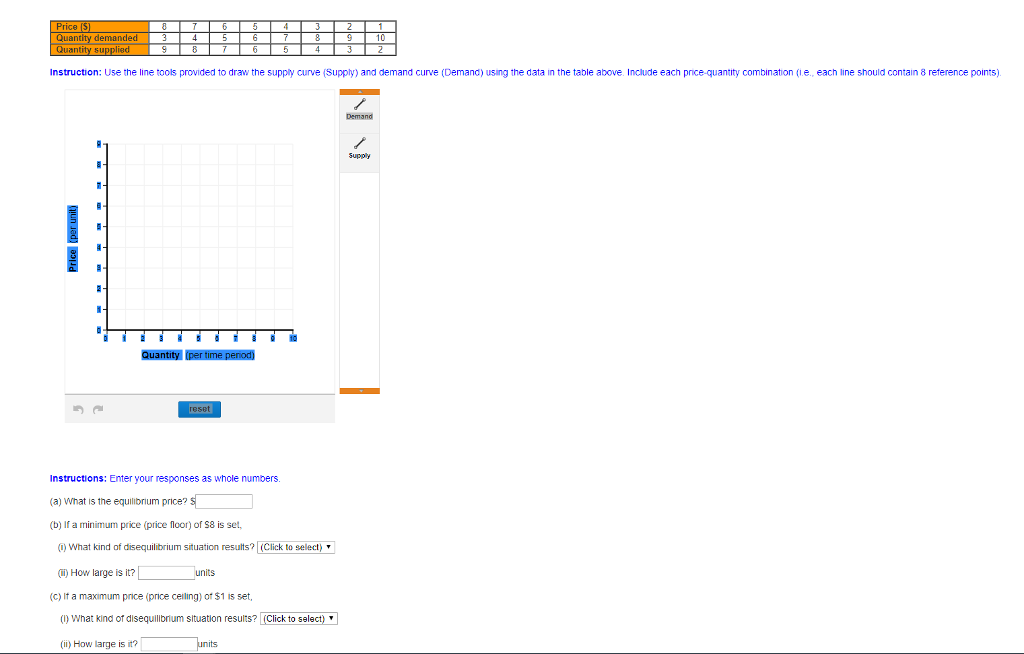
Quantity demanded Instruction: Use the line tools provided to draw the supply curve (Supply) and demand curve (Demand) using the data in the table above. Include each price-quantity combinationie, each line should contain 8 reterence points) Demand Supply reset Instructions: Enter your responses as whole numbers (a) What is the equilibrium price? (b) If a minimum price (price floor) of S8 is set, (1) what kind of disequilibrium situation results? (Click to select (i) How large is it? (c) It a maximum price (price ceiling) of $1 is set, (I) What kind of disequilibrium situation results? (Click to select (ii) How large is it
Step by Step Solution
There are 3 Steps involved in it

Get step-by-step solutions from verified subject matter experts