

Question: Quantity Demanded Quantity Supplied Price Per Unit Per Year Per Year $5 2,000 0 10 1,800 300 15 1,600 600 20 1,400 900 25 1,200
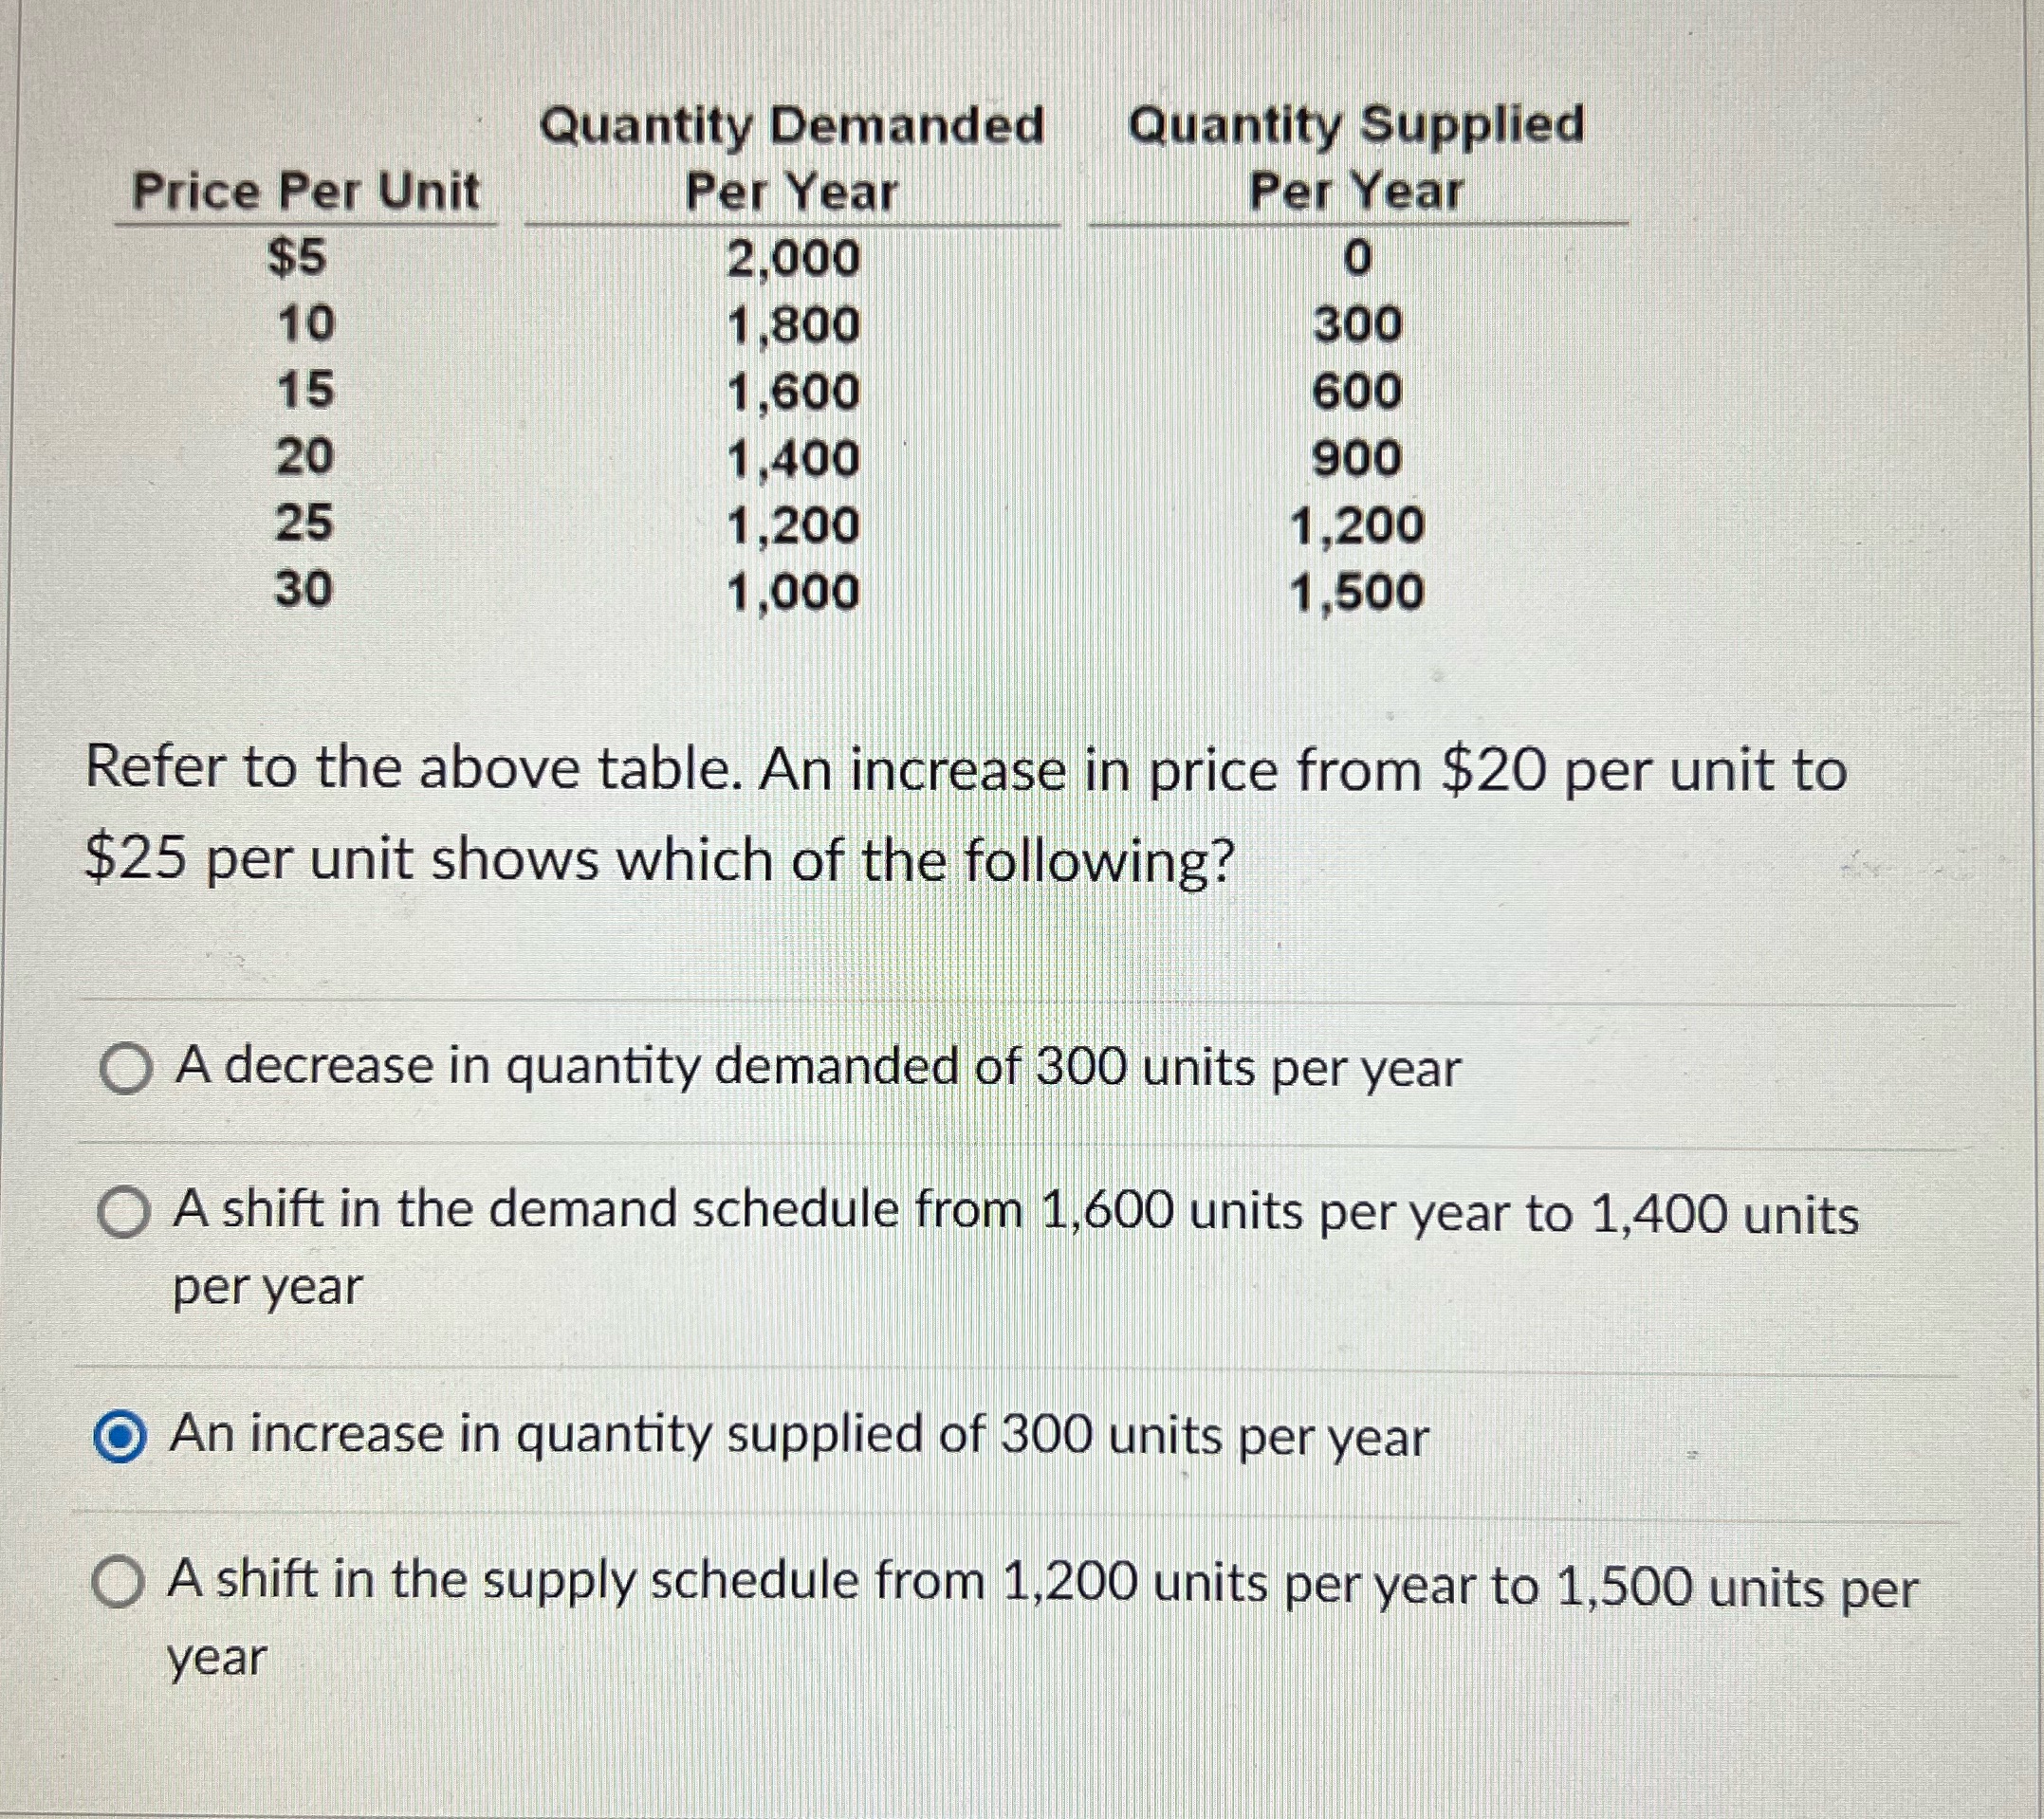
Quantity Demanded Quantity Supplied Price Per Unit Per Year Per Year $5 2,000 0 10 1,800 300 15 1,600 600 20 1,400 900 25 1,200 1,200 30 1,000 1,500 Refer to the above table. An increase in price from $20 per unit to $25 per unit shows which of the following? O A decrease in quantity demanded of 300 units per year O A shift in the demand schedule from 1,600 units per year to 1,400 units per year An increase in quantity supplied of 300 units per year A shift in the supply schedule from 1,200 units per year to 1,500 units per year
Step by Step Solution
There are 3 Steps involved in it
1 Expert Approved Answer
Step: 1 Unlock

Question Has Been Solved by an Expert!
Get step-by-step solutions from verified subject matter experts
Step: 2 Unlock
Step: 3 Unlock