Question: Quarterly demand data for two years are shown in the table below. Year/Quarter 1/1 1/2 1/3 1/4 2/1 2/2 2/3 2/4 Demand 16 32 70

Quarterly demand data for two years are shown in the table below. Year/Quarter 1/1 1/2 1/3 1/4 2/1 2/2 2/3 2/4 Demand 16 32 70 61 14 46 84 50 a) Please use Winters's method to determine initial values of the intercept, slope, and seasonal factors for each quarter. b) The demand for the first quarter of year 3 was 20. Please use a = 0.3, = 0.1, and y = 0.2 to update the estimates. c) What are the forecasts made at the end of the first quarter of year 3 for the remaining three quarters of year 3? d) The demand for the remaining three quarters of year 3 was 50, 88, and 66. Please use a = 0.3, p = 0.1, and y = 0.2 to update the estimates for the end of year 3. e) What are the forecasts made at the end of year 3 for year 6 using the Winters's method?
 Quarterly demand data for two years are shown in the table

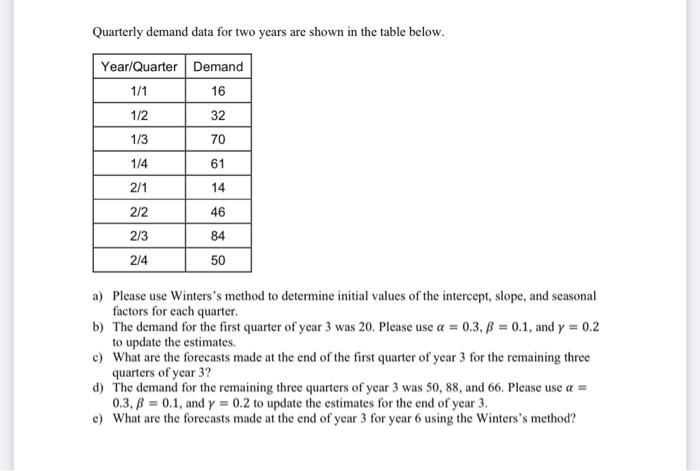
Quarterly demand data for two years are shown in the table below. a) Please use Winters's method to determine initial values of the intercept, slope, and seasonal factors for each quarter. b) The demand for the first quarter of year 3 was 20. Please use =0.3,=0.1, and =0.2 to update the estimates. c) What are the forecasts made at the end of the first quarter of year 3 for the remaining three quarters of year 3 ? d) The demand for the remaining three quarters of year 3 was 50,88 , and 66. Please use = 0.3,=0.1, and =0.2 to update the estimates for the end of year 3 . e) What are the forecasts made at the end of year 3 for year 6 using the Winters's method

Step by Step Solution

There are 3 Steps involved in it

1 Expert Approved Answer
Step: 1 Unlock blur-text-image
Question Has Been Solved by an Expert!

Get step-by-step solutions from verified subject matter experts

Step: 2 Unlock
Step: 3 Unlock

Students Have Also Explored These Related General Management Questions!