

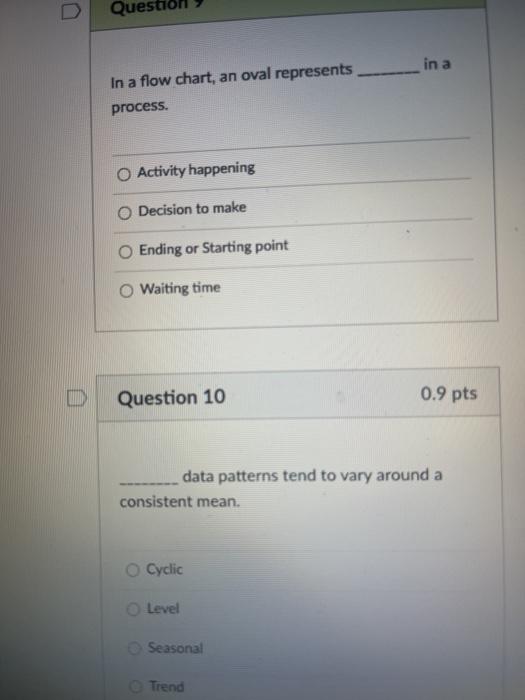
Question: Ques in a In a flow chart, an oval represents process. Activity happening Decision to make O Ending or Starting point Waiting time Question 10
Step by Step Solution
There are 3 Steps involved in it
1 Expert Approved Answer
Step: 1 Unlock

Question Has Been Solved by an Expert!
Get step-by-step solutions from verified subject matter experts
Step: 2 Unlock
Step: 3 Unlock